Gambling Statistics - The Ultimate List

With the global casinos and online gambling market size reaching $230.9 billion in 2021, this industry has been surpassing expectations year over year. Even with the worldwide pandemic, while land-based gambling facilities suffered a strong blow, online and mobile operators reached record-high revenues. All gambling statistics show that the sector isn’t going to slow down anytime soon. In fact, as more and more US states legalize various land-based and online gambling activities, experts forecast significant growth. Want to get mind-blown with some nifty stats and facts about gambling? If so, scroll down!
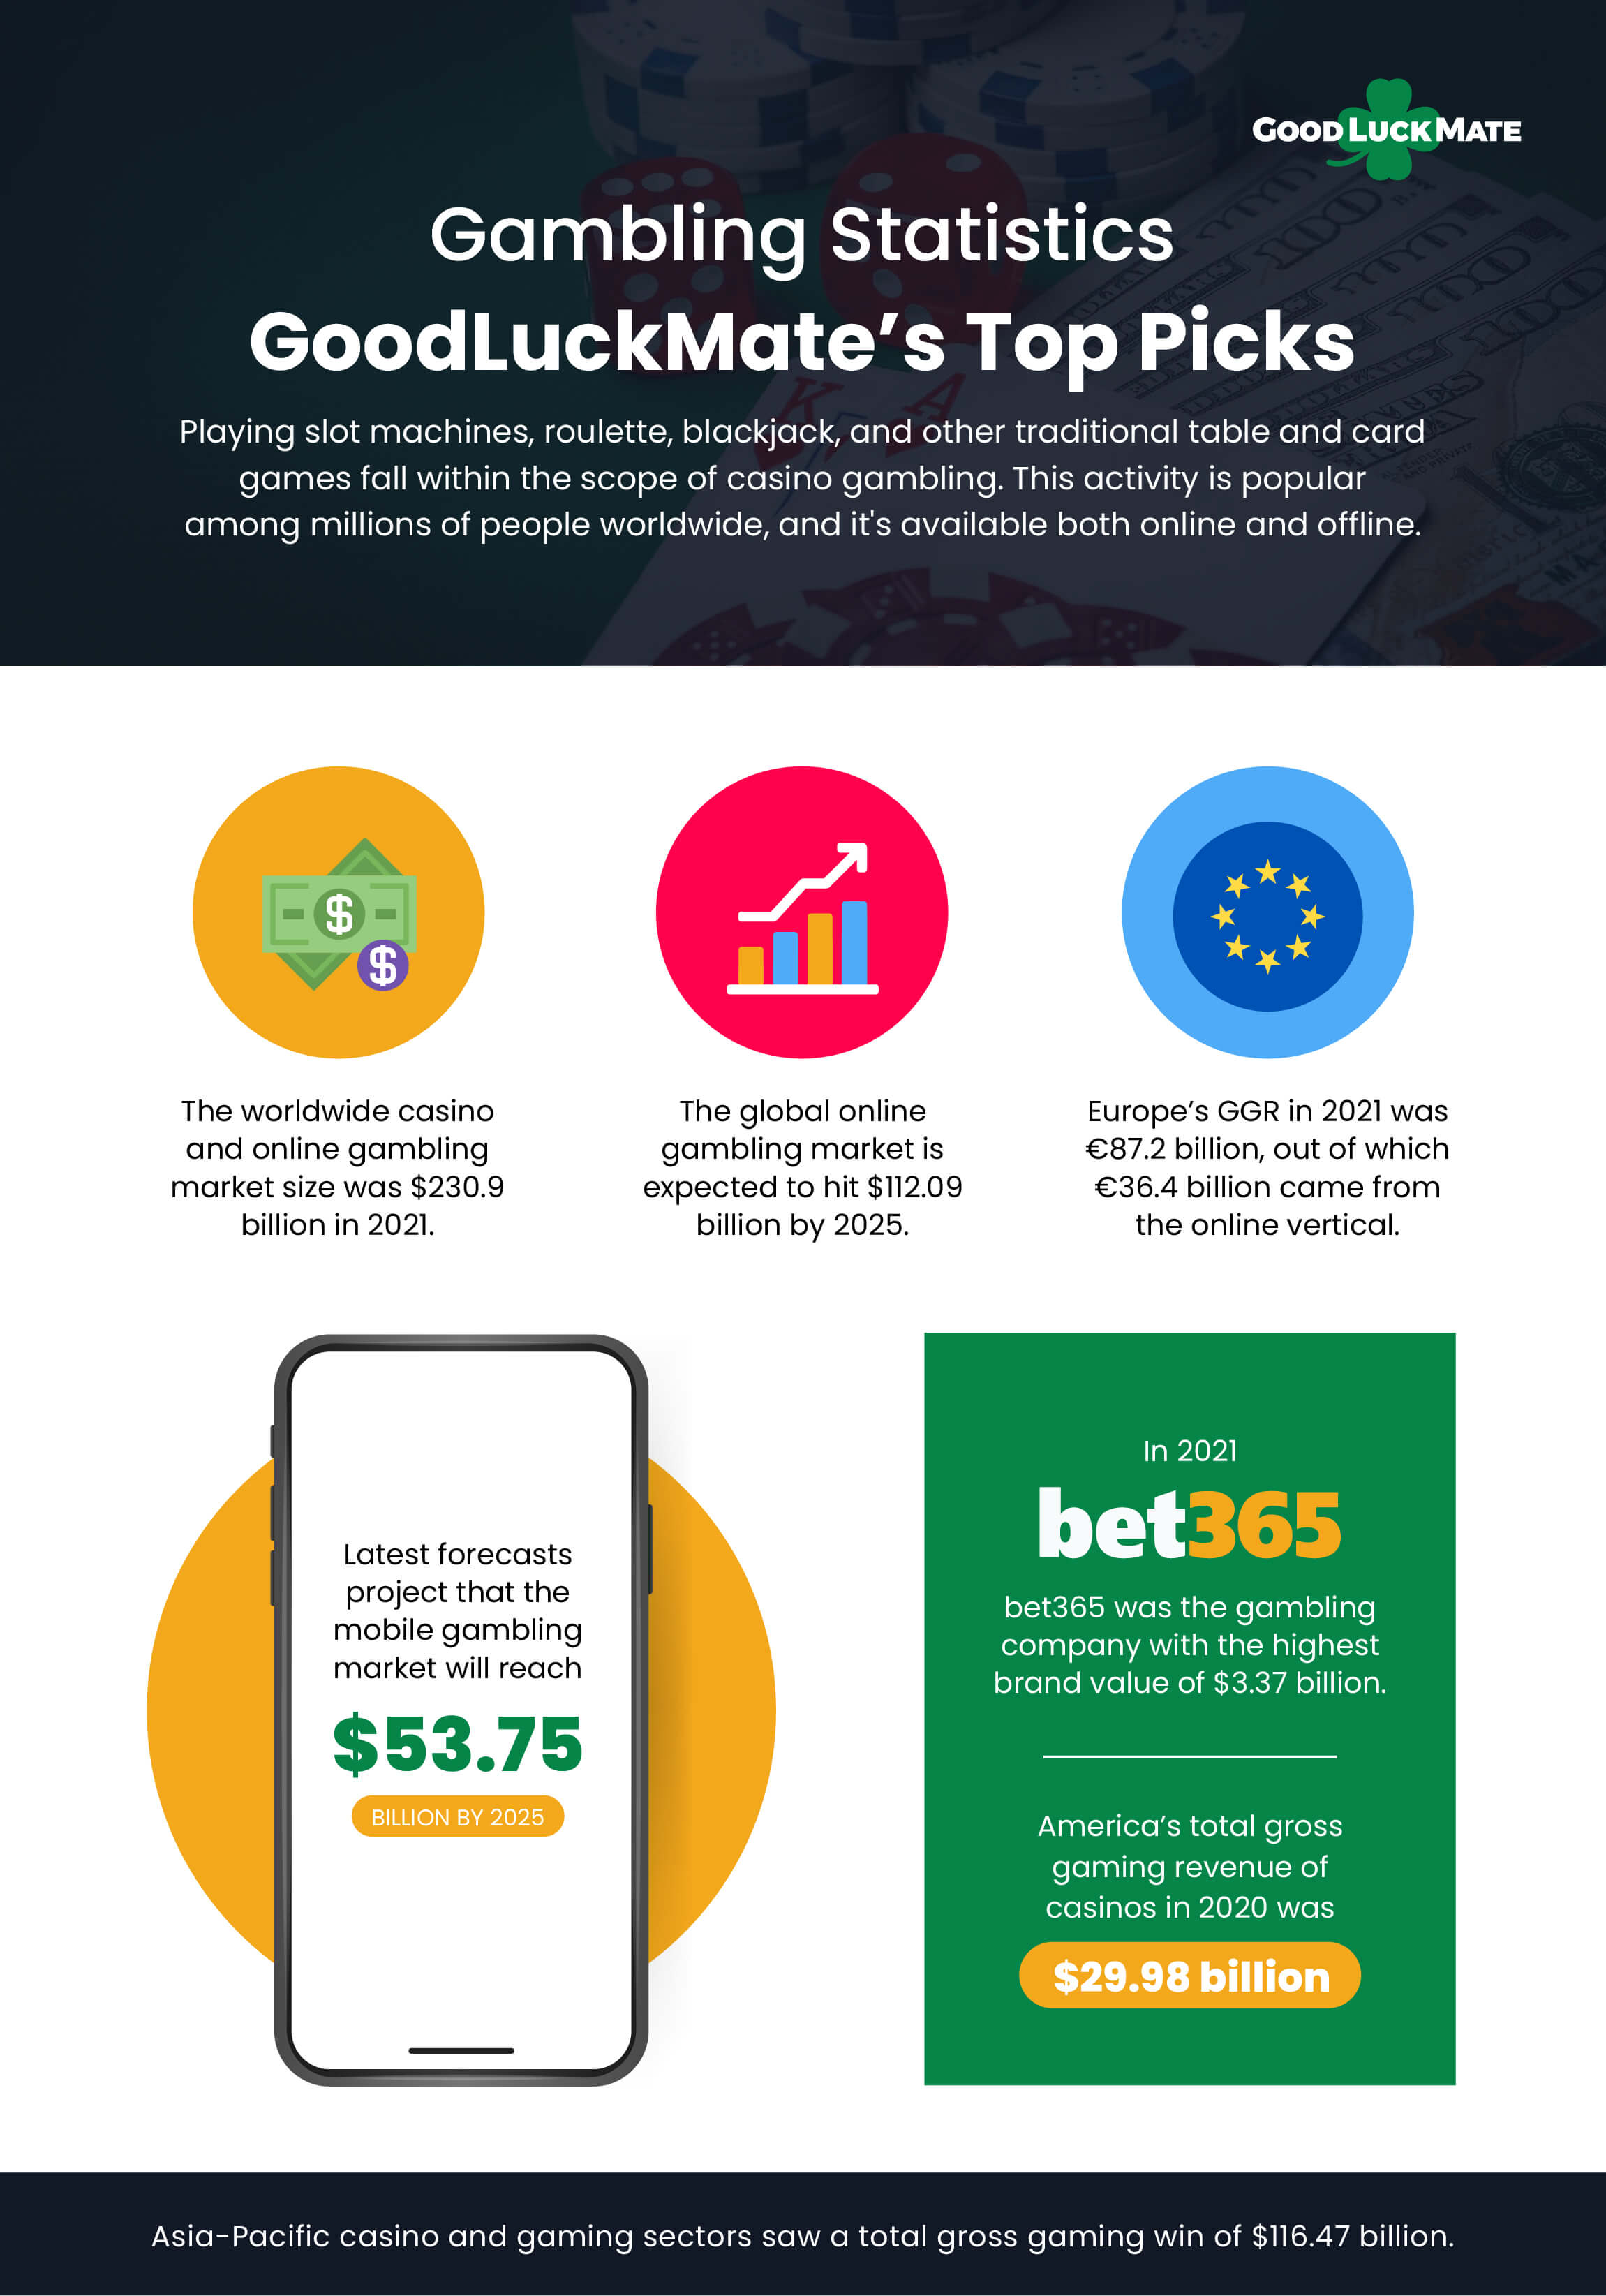
Gambling Statistics – GoodLuckMate’s Top Picks
- The worldwide casino and online gambling market size was $230.9 billion in 2021.
- The global online gambling market is expected to hit $112.09 billion by 2025.
- Europe’s GGR in 2021 was €87.2 billion, out of which €36.4 billion came from the online vertical.
- Latest forecasts project that the mobile gambling market will reach $53.75 billion by 2025.
- Between 3-5% of Americans are gambling addicts.
- In 2021, bet365 was the gambling company with the highest brand value of $3.37 billion.
- About 26% of the global population partakes in gambling.
- The global casino and online gambling industry is the 49th largest in the world.
- America’s total gross gaming revenue of casinos in 2020 was $29.98 billion.
- Asia-Pacific casino and gaming sectors saw a total gross gaming win of $116.47 billion.
 Statistics About Gambling to Know This Year
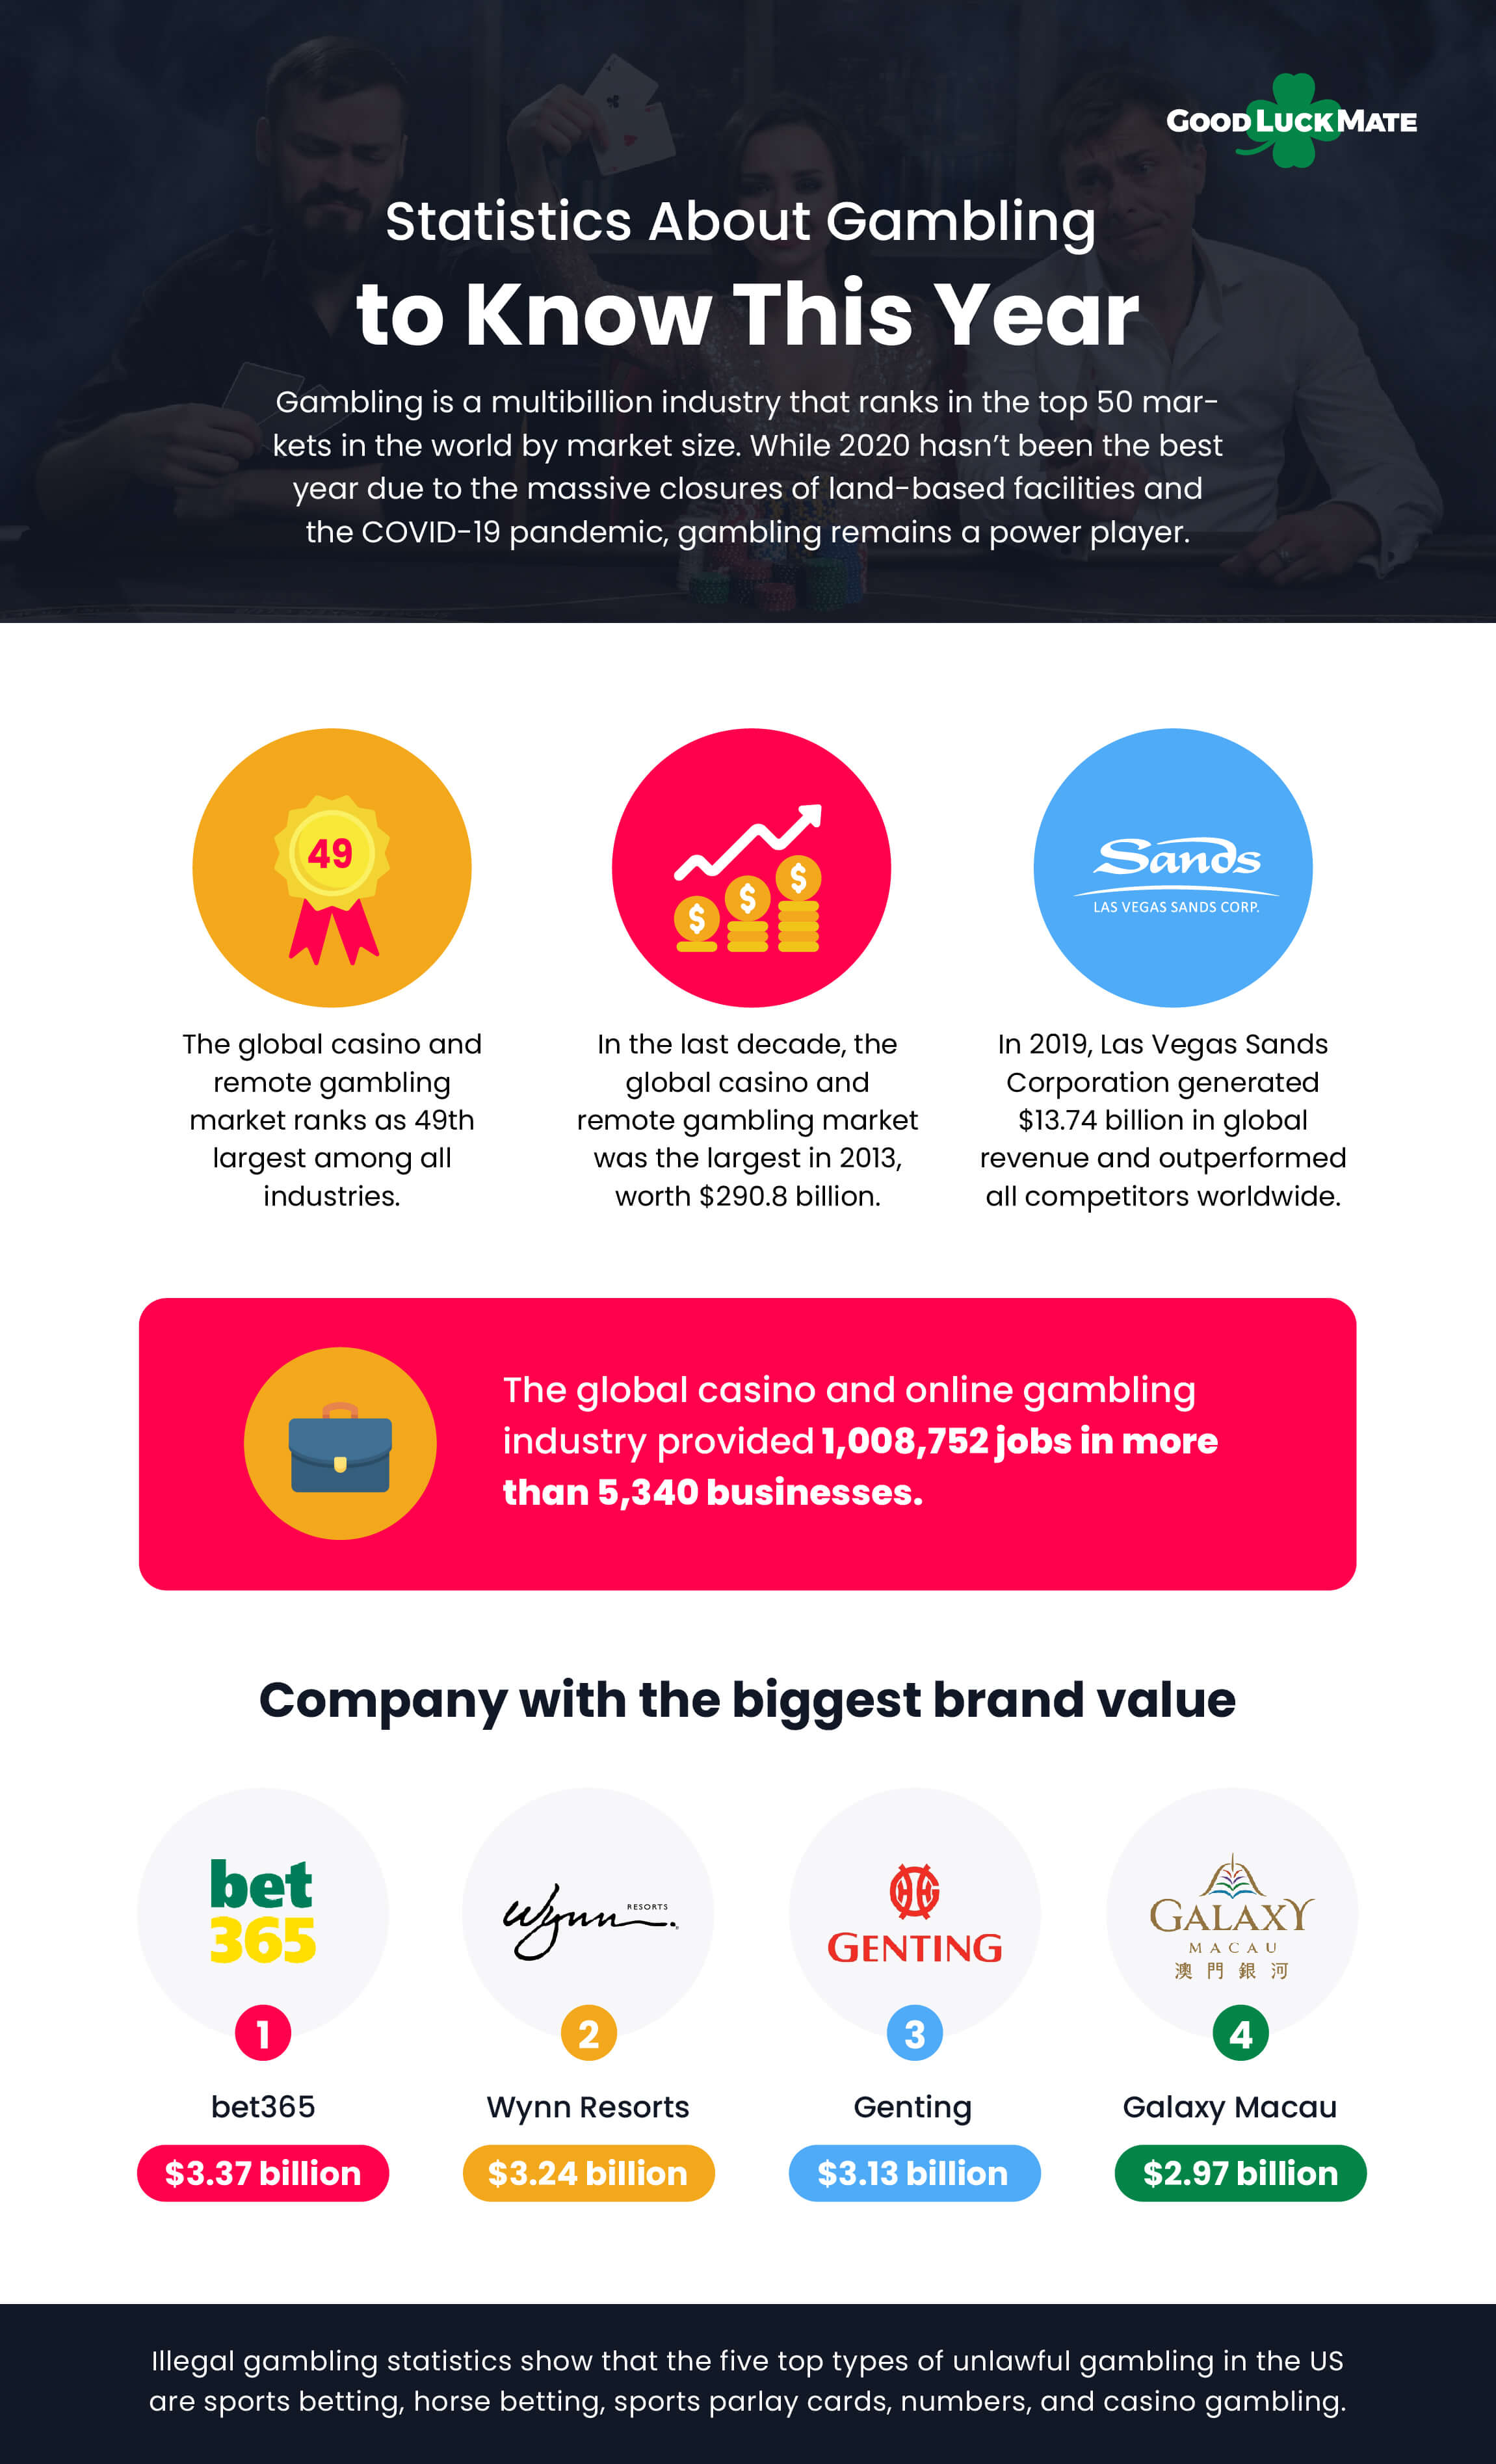
Gambling is a multibillion industry that ranks in the top 50 markets in the world by market size. While 2020 hasn’t been the best year due to the massive closures of land-based facilities and the COVID-19 pandemic, gambling remains a power player. There’s already been a drastic improvement when it comes to global revenues and further growth is forecasted in all gambling statistics.
- The global casino and remote gambling market size in 2021 was $230.9 billion.
- The global casino and online gambling industry provided 1,008,752 jobs in more than 5,340 businesses.
- The global casino and remote gambling market ranks as 49th largest among all industries and 1st largest in the Other Global Community, Social, and Personal Service Activities.
- The latest statistics about gambling reveal that global casino and remote gambling market size has dropped by about 1.9% a year on average in the last five years.
- In the last decade, the global casino and remote gambling market was the largest in 2013, worth $290.8 billion.
- In the last decade, the global casino and remote gambling market was the smallest in 2020, when its value was $202.54 billion.
- bet365 was the company with the biggest brand value of $3.37 billion in 2021.
- According to the gambling statistics worldwide, the second-largest company by brand value in 2021 was Wynn Resorts, whose brand was worth $3.24 billion. These brands were followed by Genting ($3.13bn), Galaxy Macau ($2.97bn), and Marina Bay Sands ($2.36bn).
- In 2016, the most common reasons for gambling online were money (55.9%), fun (54.5%), and the lure of winning (53.3%).
- In 2019, Las Vegas Sands Corporation generated $13.74 billion in global revenue and outperformed all competitors worldwide.
- Illegal gambling statistics show that the five top types of unlawful gambling in the US are sports betting, horse betting, sports parlay cards, numbers, and casino gambling.
Gambling Statistics Worldwide
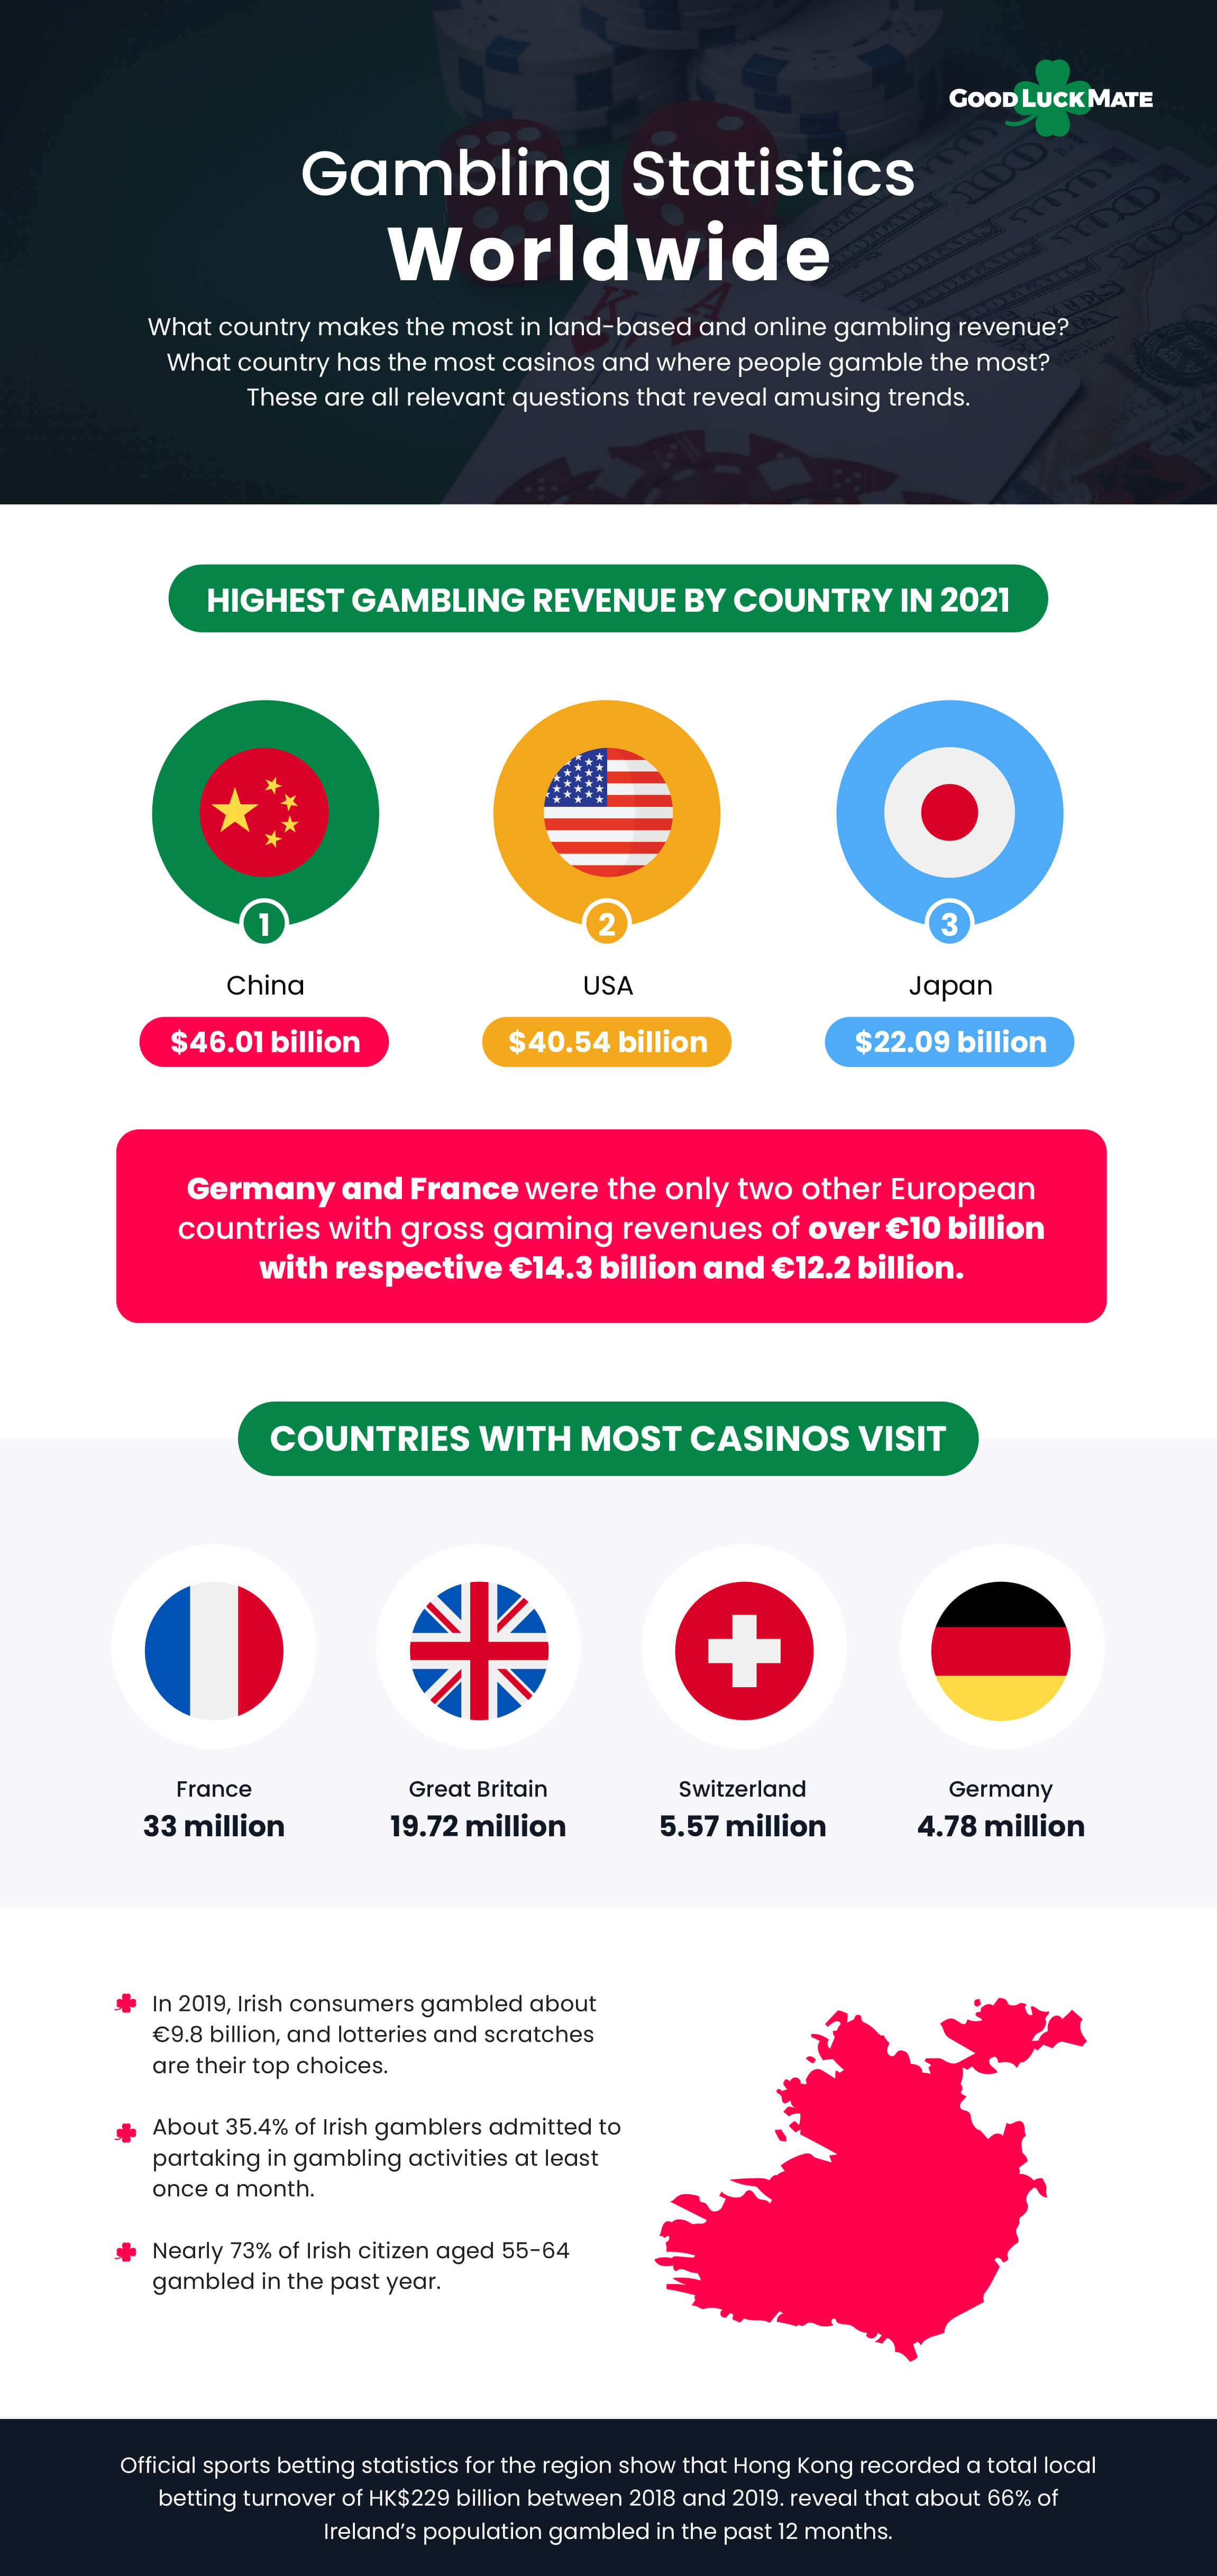
 Gambling Statistics Worldwide
What country makes the most in land-based and online gambling revenue? What country has the most casinos and where people gamble the most? These are all relevant questions that reveal amusing trends. Want to learn more? We have some interesting trends for you below, including gambling statistics for Germany, the UK, the USA, and more.
- In 2021, China ($46.01 billion), the USA ($40.54 billion), and Japan ($22.09 billion) generated the highest gambling revenue by country.
- Europe’s GGR in 2021 was €87.2 billion. More than half of that revenue (€50.8bn) came from land-based operations. The remaining €36.4 billion came from the online vertical.
- According to the latest EGBA data, Europe’s GGR should hit €126.3 billion by 2026.
- About 41% of Europe’s online gambling industry revenue comes from sports betting.
- Europe’s online gambling gross wins are forecasted to hit €29.3 billion in 2022.
- According to 2019’s gambling statistics for Europe, Italy recorded the highest gross gaming revenue of €18.1 billion among European countries.
- Germany and France were the only two other European countries with gross gaming revenues of over €10 billion with respective €14.3 billion and €12.2 billion.
- Poland and its gross gaming revenue of €1.5 billion ranked lowest compared to other EU countries in 2018.
- France gambling statistics show the country saw the most casino visits (33 million) in 2017 and was followed by Great Britain (19.72 million), Switzerland (5.57 million), and Germany (4.78 million).
- Europe’s GGR is expected to hit €33 billion by 2023, and about 55% of that is expected to come from mobile gambling.
- The Czech Republic was the European country with the most associated casinos (299).
- In 2019, Irish consumers gambled about €9.8 billion, and lotteries and scratches are their top choices.
- Official sports betting statistics for the region show that Hong Kong recorded a total local betting turnover of HK$229 billion between 2018 and 2019. reveal that about 66% of Ireland’s population gambled in the past 12 months.
- About 35.4% of Irish gamblers admitted to partaking in gambling activities at least once a month.
- Nearly 73% of Irish citizen aged 55-64 gambled in the past year.
Gambling in the UK
 Gambling in the UK
The United Kingdom has one of the strongest gambling markets in the world. Besides a developed land-based market, Brits can boast an ever-growing iGaming industry, as well.
- Gambling statistics in the UK show that the total gross gambling yield between April 2019 and March 2020 was £14.2 billion.
- The online gross gambling yield in the UK between April 2018 and March 2019 was £5.7 billion.
- The remote gambling sector is the largest by total GGY, representing 38.6% of the market.
- The total GGY for brick-and-mortar casinos in the UK between October 2019 and September 209 was £1.1 billion.
- The Great Britain gambling employment statistics show that this sector employed 98,174 people in September 2019.
- Online casino total GGY between October 2018 and September 2019 was £3.2 billion.
- About 0.5% of 16–24-year-olds in the UK have a gambling problem.
- In the year to June 2021, the internet gambling participation among Brits was 25% or by 3% higher compared to the same period the previous year.
- In June 2021, online gambling participation among Brits was highest for National Lottery draws (13.8%) and followed by another lottery (7.9%), sports betting (4.8%), and casino games (1.1%).
- In June 2021, the gambling industry statistics revealed that most gamblers (31.4%) played once a month, while the rest played once a week (29.5%), two or more days a week (21.3%), or less than once a month (17.8%).
Gambling in the US
Americans love gambling and betting, yet the country hasn’t always been on excellent terms with both activities. However, many states have opened to the concepts and legalized one or both of them. Every year, more American states are also introducing regulations for opening to remote gambling. Here are some impressive gambling statistics for the US market.
- The average gambling loss among American adults was $400 in 2016.
- The total commercial gaming revenue in the US in August 2020 was $4.44 billion, or 19% more compared to August 2019.
- The total slot GGR in August 2020 was $2.87 billion, which is better by 14.1% compared to August 2019.
- The GGR of table games and sports betting in August 2020 was $777.3 million and $217.3 million, respectively.
- Statistics on gambling in the US throughout August 2020 show that the iGaming GGR in the country reached $304.6 million, seeing a jump of an impressive 579.5%.
- Between January 2020 and August 2020, America saw a total GGR of $34.15 billion, out of and $21.51 billion came from slots.
- The iGaming GGR in the United States between January 2020 and August 2020 was $2.30 billion.
- Gambling statistics by country show that casinos' total gross gaming revenue in the United States in 2020 was $29.98 billion.
- Nevada recorded the highest gross gaming revenue of casinos of $7.87 billion.
- New Jersey and Pennsylvania came second and third with respective gross gaming revenues of $2.88 billion and 2.69 billion.
- Montana, DC, and Oregon saw the lowest gross gaming revenues of casinos in 2020 of respective $2.36 million, $13.55 million, and $20.07 million.
- American 2020 casino gambling statistics reveal that there were 525 tribal casinos in the US, significantly more than the 456 tribal casinos registered ten years ago.
- Las Vegas NV, Atlantic City, NJ, Reno NV, Tunica MS, and Chicago IL are the most popular gambling cities in the United States.
- The casino industry creates 370,000 jobs in Sin City and attracts visitors that spend about $34.4 billion per year, per the latest Las Vegas gambling statistics.
Gambling in Canada
Canada doesn’t have some strict regulations when it comes to gambling. In fact, the country is one of those where players can freely gamble online at offshore sites due to a lack of official rules. Legal or not, gambling remains a popular activity among Canadians. So, it’s only fair to share some stats and dive deeper into the data.
- Canadians with the most serious gambling problem sometimes lose over $500,000 per year, the latest gambling statistics for Canada show.
- About three-fourths of Canadians partake in gambling.
- Canadian consumers love scratch cards and lotteries the most.
- The Canadian gambling market is worth about $14.04 billion in 2021.
- Canadian adults contribute to an average revenue of about $503 a year.
Gambling in Australia and New Zealand
When it comes to gambling laws and gambling habits, Aussies and Kiwis have a lot in common. From their love for pokies to their unclear regulations, you don’t need gambling statistics for New Zealand or Australia to spot the similarities. Yet, we went and handpicked some cool stats and facts for gambling in these countries, nonetheless.
- The total gambling turnover in Australia was AU$225.75 billion in 2019.
- The largest share of AU$187.67 billion came from gaming, while racing and betting contributed with respective AU$26.96 billion and AU$11.11 billion.
- Casino and gaming machines noted the biggest gambling turnovers in the Gaming sector of AU$26.23 billion and AU$153.56 billion.
- Gambling statistics in Australia show that New South Wales has the largest gambling market in Australia, worth AU$96.56 billion.
- The total per capita gambling turnover in Australia was AU$11,525 in 2019.
- The total gambling expenditure in all Australian states was AU$25 billion in 2019.
- The total gambling expenditure for all gambling activities in New Zealand was NZ$2.25 billion in 2020.
- NZ gambling statistics show that gaming machines outside casinos contributed the most here, with an annual expenditure of NZ$802 million.
- The gaming machines were followed by the casinos (NZ$504 million), NZ lotteries (NZ$631 million), and the NZ racing board ($315 million).
- The total annual gambling expenditure in New Zealand improved from NZ$2.20 billion in 2016 to NZ$2.25 billion in 2020.
Gambling in Asia-Pacific Countries
Gambling is seen as a hobby in many Asia-Pacific countries and even as a cultural thing rooted in national traditions. So, it makes sense that the Asian gambling market is essential to both land-based and online operators. While everyone would guess that here we’d focus on Macau gambling statistics, you’d be surprised that many other countries in the region have well-established gambling industries too.
- In 2020, the Asia-Pacific casino and gaming sectors recorded a total gross gaming win of $116.47 billion.
- The compound annual rate of change in the total gross gaming win in the Asia-Pacific gambling market between 2016 and 2020 was -8.5%.
- The total gross gaming win noted in the Japanese casino and gaming sector in 2018 was $33.6 billion.
- Japanese citizens can visit casinos up to three times a week and ten times a month, and each visit comes with a JPY6,000 ($50) entry fee.
- Latest Singapore gambling statistics show that the casino and gaming sector in the city-state saw a total gross gaming win of $6.57 billion in 2020.
- The Singaporean total gross gaming win’s compound annual rate of change between 2016 and 2020 was -0.4%.
- The total casino and gaming sector in South Korea hit a total gross gaming win of $8.2 billion in 2019, with casino gross gaming win representing $2.5 billion or 30.9% of that amount.
- According to 2018 gambling statistics for the Philippines, the country's annual revenues of online gambling operations hit $1.6 billion.
- In 2016, the Chinese total gross gaming win of the casino and gaming sector hit $55.07 billion.
- In 2020, Macau's total gross gaming and gambling revenue was about MOP$61 billion or about $7.61 billion.
- The gambling participation rate among Hong Kong residents aged 15-64 dropped from 78% in 2001 to 62% in 2016, official gambling statistics for Hong Kong reveal.
- The average monthly spending in 2016 on horserace betting in Hong Kong was HK$5,611.
- The average football betting and mark six lottery spending for the same year were respective HK$1,599 and HK$160.
- Official sports betting statistics for the region show that Hong Kong recorded a total local betting turnover of HK$229 billion between 2018 and 2019.
- Aside from the fact that Thai authorities have blocked over 1,200 illegal gambling sites, there are not many helpful gambling statistics for Thailand considering the country’s strict regulations for the sector.
Gambling in African Countries
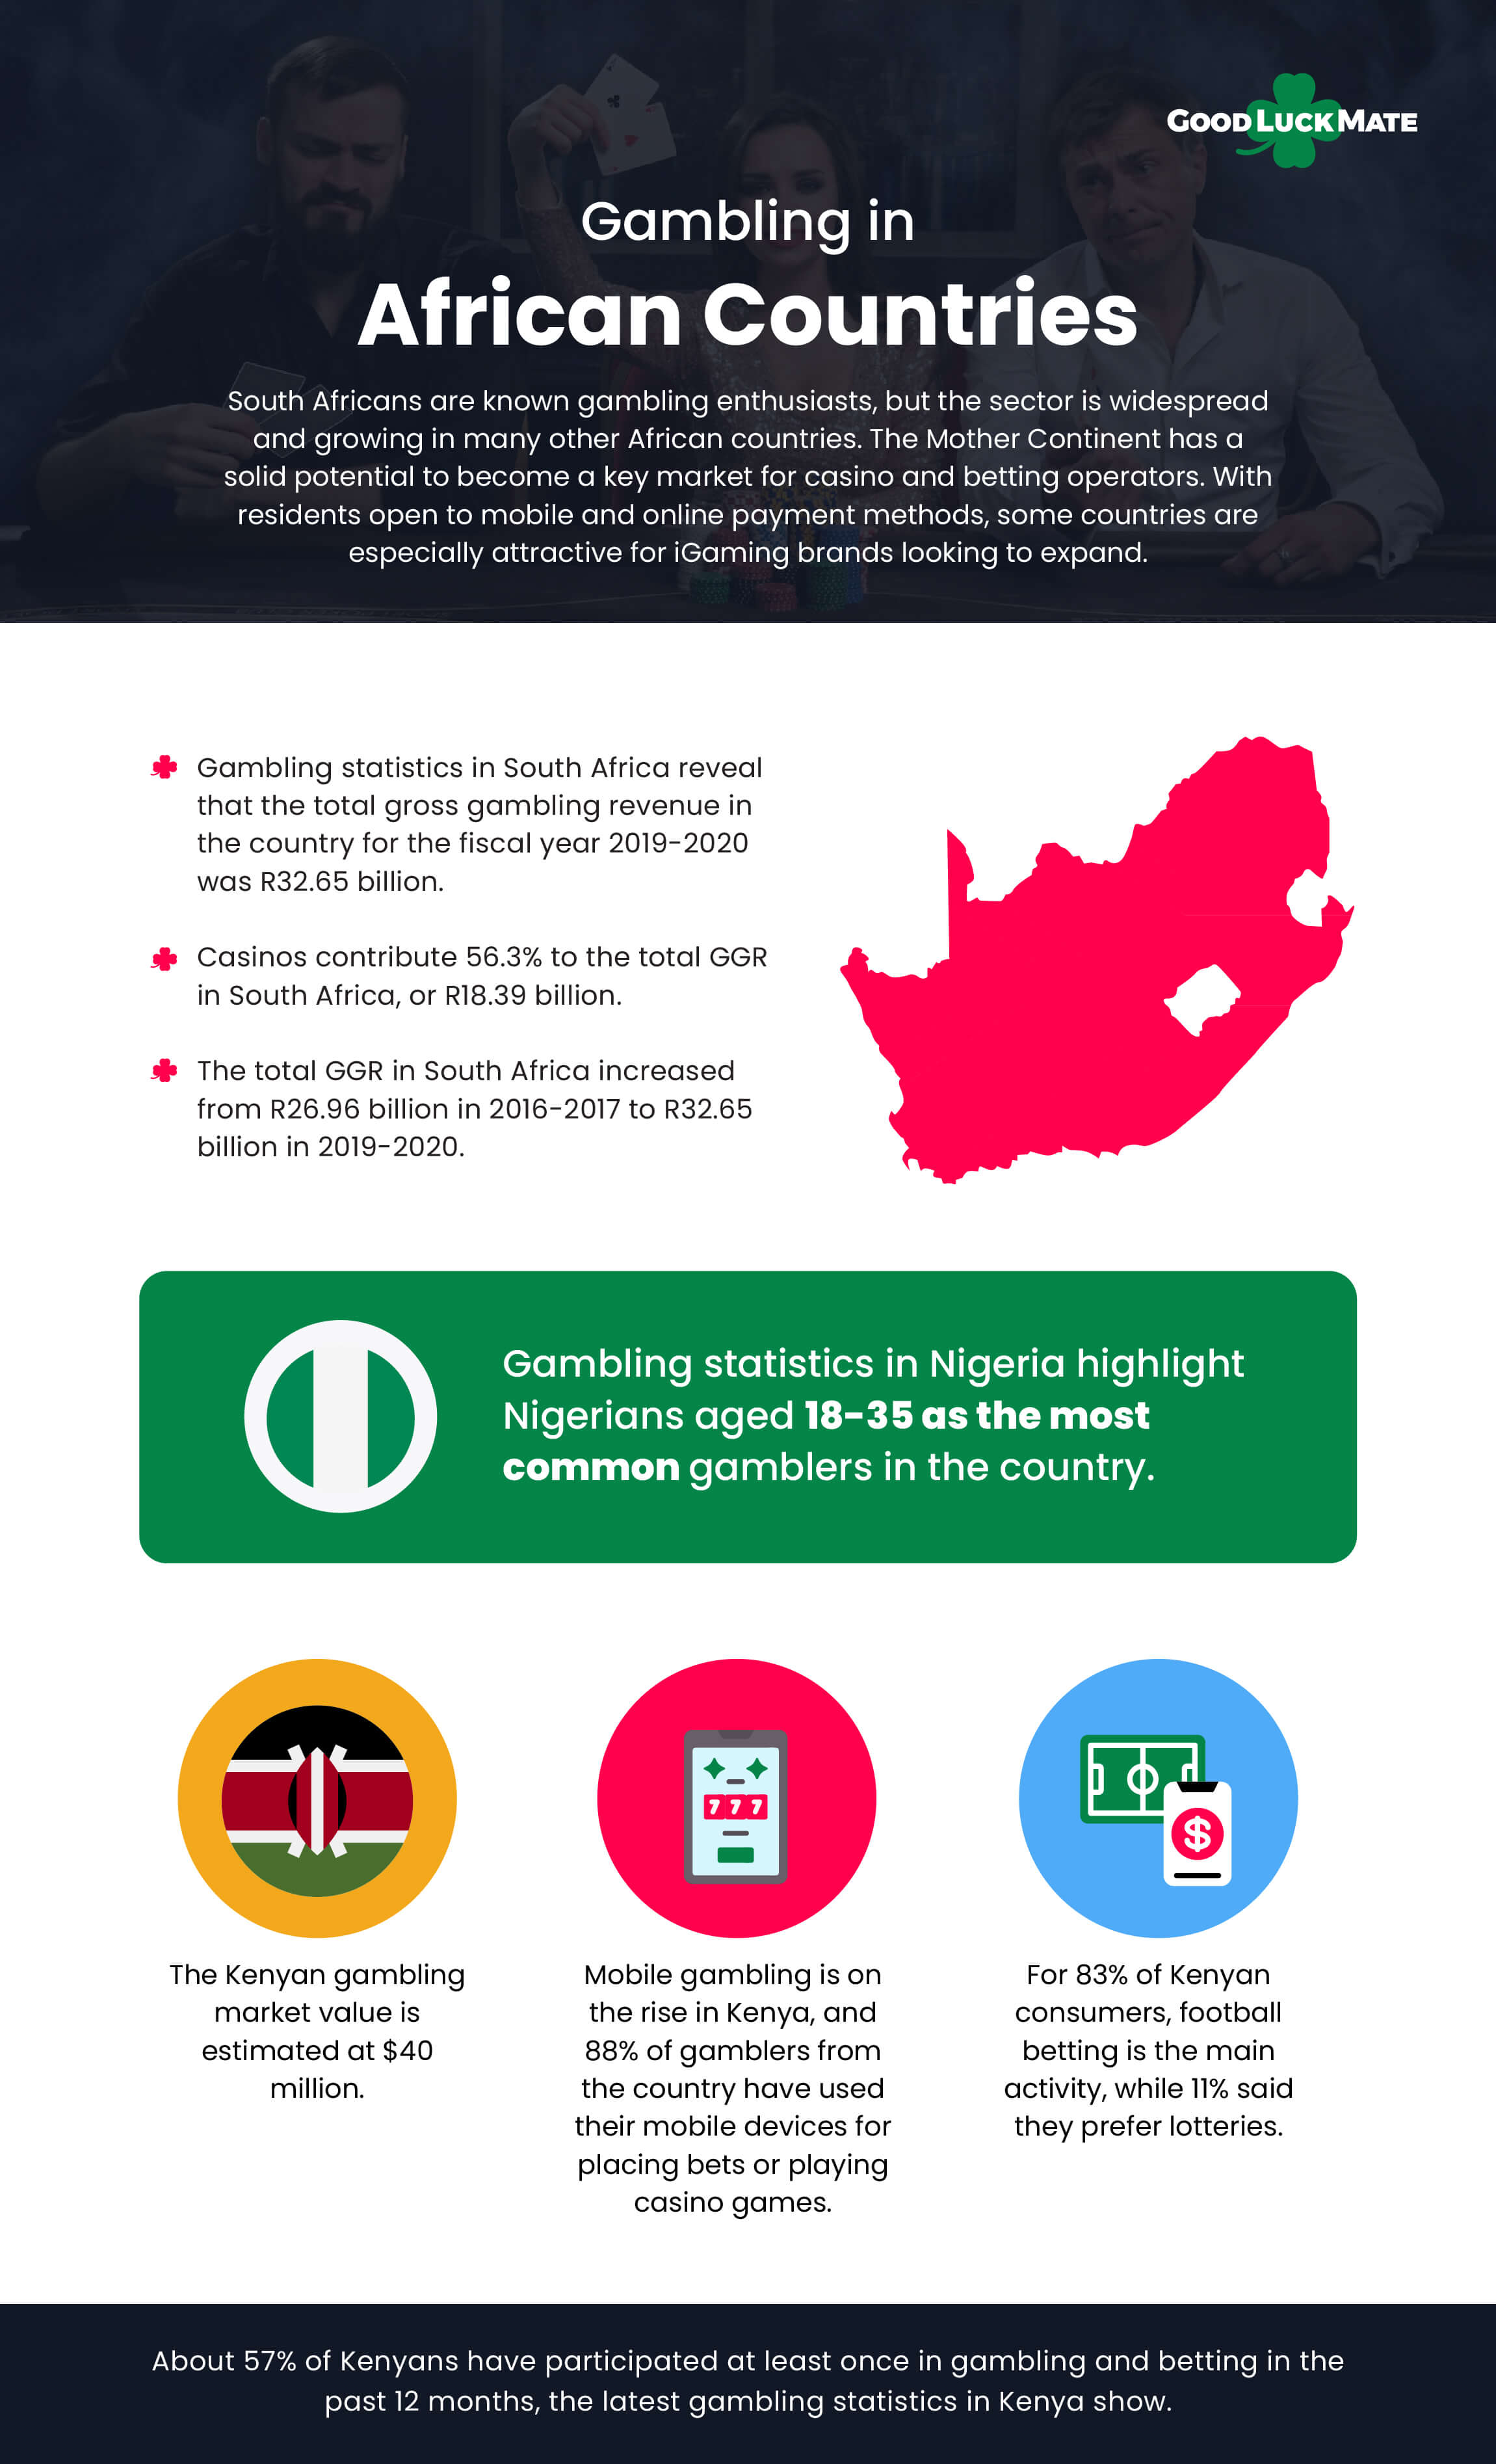
South Africans are known gambling enthusiasts, but the sector is widespread and growing in many other African countries. The Mother Continent has a solid potential to become a key market for casino and betting operators. With residents open to mobile and online payment methods, some countries are especially attractive for iGaming brands looking to expand.
- Gambling statistics in South Africa reveal that the total gross gambling revenue in the country for the fiscal year 2019-2020 was R32.65 billion.
- Casinos contribute 56.3% to the total GGR in South Africa, or R18.39 billion.
- Betting, limited payout machines (LPMs), and bingo noted GGRs of respective R8.76 billion, R3.68 billion, and R1.81 billion.
- The total GGR in South Africa increased from R26.96 billion in 2016-2017 to R32.65 billion in 2019-2020.
- About 77% of Nigerians acknowledged the growing trend of gambling and betting.
- Gambling statistics in Nigeria highlight Nigerians aged 18-35 as the most common gamblers in the country.
- The average daily investment among Nigerians on sports betting and gambling is about N3,000 or about $7.30.
- Most Nigerian gamblers engage in gambling and betting to get quick money (30%), while unemployment (21%) and greed (15%) are two other common reasons for partaking in such activities.
- The Kenyan gambling market value is estimated at $40 million.
- About 57% of Kenyans have participated at least once in gambling and betting in the past 12 months, the latest gambling statistics in Kenya show.
- Mobile gambling is on the rise in Kenya, and 88% of gamblers from the country have used their mobile devices for placing bets or playing casino games.
- For 83% of Kenyan consumers, football betting is the main activity, while 11% said they prefer lotteries.
Gambling Trends and Stats by Demographics
 Gambling Trends and Stats by Demographics
Are you interested in the gambling demographics? Who gambles more, men or women? Are younger generations more likely to partake in activities that include playing games of luck? Any stats related to the demographics of gamblers help operators tailor their services to their most likely customers. They also reveal trends that help experts understand players' gambling habits from different age groups, gender, and race. Scroll down to find some worrying teenage gambling statistics, gambling trends by gender, and more.
Gambling Trends by Gender
We are all humans. That much is a fact. Yet, even when it comes to gambling, men and women seem to have different habits. Men seem to gamble more often and spend more money on the activity. Women seem more interested in the fun and cashing out larger winnings. Let these gambling statistics by gender highlight some of the key differences.
- In June 2021, 43.5% of UK males participated in at least one gambling activity.
- In June 2021, 39.8% of UK females gambled at least once.
- Compared to June 2017, the share of both men and women gambling in the UK has dropped.
- In June 2021, 27.7% of men and 21.8% of women in the UK participated in online gambling.
- According to a 2016 survey, 56.2% of men and 43.8% of women gamble.
- Gambling winning statistics show that about 75% of women and only 61% of men who gamble would cash in winnings immediately if they hit £500.
- About half of female gamblers spend £1-10 a week on gambling, while most male gamblers spend £11-20.
- In New Jersey, 72.8% of men and 66.9% of women gambled at least once in the past year.
- Among New Jersey residents, more women (84.3%) than men (67.2%) endorsed gambling in land-based facilities.
Gambling Statistics by Race and Ethnicity
Some people do it for fun, and for many, gambling turns into a nightmare. While there aren’t many studies focused on the positive, there are research papers on how problem gambling affects players from different races and ethnicities. Depending on culture and traditions, players from some races and ethnicities may be more inclined to partake in gambling.
Gambling losses statistics show that the average loss in the US per adult is $400. Unfortunately, we didn’t find any research focused on spending by race. Still, we have some amusing stats that you may want to check out.
- In New Jersey, the percentage of white, Hispanic, and African Americans who gambled in the past 12 months is 71, 69, and 68.6, respectively.
- Still, African Americans have twice the rate (2.2%) of disordered gambling activities compared to white Americans.
- Statistics about gambling reveal that 80.7% of white gamblers in New Jersey gamble in land-based casinos only.
- In the Garden State, Hispanics and Asians note the highest problem gambling rates at 16.2% and 14.1%.
- Southeast Asian refugees in the US note high rates of gambling addiction of 59%.
- Studies discovered that Chinese and Korean males living in the US with alcohol and drug problems often also have higher chances of being problem gamblers.
- Baccarat, mahjong, pachinko, sic bo, and pai gow poker are the five most popular casino games among Asian players.
- Roulette, blackjack, poker, and other table games are the top picks among African gamblers.
Gambling Statistics by Age
With gambling being one of those potentially harmful activities, it makes sense that lots of effort go into protecting the youth. But there are other key points here. Who gambles the most? How gamblers from different age groups act, and what games do they prefer? Well, let’s discover the latest data!
- About 69% of adults aged 61+ gamble every year.
- Adults over 61 are least likely to consider gambling an addiction.
- Based on gambling facts and statistics, most people aged 45 and up consider problem gambling a moral deficiency rather than a treatable condition.
- Brits aged 45-54 have the highest gambling participation rate of 49.4%.
- Brits aged 16-24 have the lowest gambling participation rate of 32.2%.
- The remaining age groups come in the middle with respective participation rates of 36.4% (24-34), 39% (65+), 42.9% (35-44), and 48% (55-64).
- Millennial gambling statistics show that millennials are the biggest spenders in online gambling, and they prefer debit card payments.
- Generation X online gamblers prefer financing their hobby with credit cards.
Online and Mobile Gambling Facts and Stats
Online and mobile gambling are two sectors with immense growth potential, the latest internet gambling statistics show. Players worldwide love the convenience of playing casino games on the move or from the comfort of their homes. While the experience doesn’t compare to the live action, it often proves enough for millions of consumers across the globe. That’s why there are more than 2,000 iGaming sites worldwide, the latest casino industry statistics reveal.
- The global remote gambling market will reach $72.02 billion in 2021.
- The global gambling industry worth is expected to grow by 12.3% CAGR in 2021 from the $64.13 billion noted in 2020.
- PRNewswire online gambling statistics forecast that the worldwide remote gambling sector is expected to hit an impressive $112.09 billion by 2025.
- In June 2021, 24.7% of Brits participated in at least one form of remote gambling.
- Between June 2017 and June 2021, Brits' remote gambling participation rate jumped from 17.6% to 24.7% or by 7.1%.
- Europe’s online GGR in 2021 was € 36.4 billion. EGBA forecasts expect continuous growth in this segment. So, in the next five years, the projected online GGR of the European market was €39.1bn, €42.2bn, €45.5bn, €48.5bn, and €52bn, respectively.
- In Europe, there’s been a positive trend regarding regulated online gambling. The share of activities in the regulated market has been increasing year over year. In 2019, 77.3% of all gambling happened at legal casino sites. In 2020 and 2021, this share jumped to 79.5% and 82.7%. By 2026, it’s expected to reach a record-high 88.6%.
- Mobile gambling via smartphones and tablets is on the rise in Europe, too. In 2019, about 44.6% of the gambling activities were on such devices. In 2021, the share has increased to 50.5% and by 2026 it’s projected to reach 61.5%.
- As for scary online gambling stats, did you know that about 8% of gamblers admit to gambling online while driving?
- The most unusual places to participate in online gambling include in front of the TV (34%), on the toilet (25%), and during family events (11%).
- In 2018, Europe held the highest share of 57.20% of the global mobile gambling market.
- However, the Asia-Pacific region is expected to be the fastest-growing mobile gambling market with a forecasted CAGR of 13.8%.
- Mobile gambling statistics project that the mobile gambling market will hit an impressive $53.75 billion by 2025.
- Some experts estimate the crypto gambling market value at about $250 million.
- According to a SOFTSWISS study based on its Game Aggregator and Casino Platform, 23% of all online casino bets were made with crypto in January 2021. By December 2021, that share skyrocketed to 40.1%.
- Bitcoin, Ethereum, and Litecoin are the most popular cryptocurrencies for iGaming. Their usage represented 80.11%, 9.88%, and 4.52% of all crypto gambling bets, the SOFTSWISS’ internet gambling stats reveal.
- The top five most popular online casino game providers among crypto gamblers are BGaming (21.10%), Platypus (13.53%), Evolution (13.47%), Booming (10.76%), and Betsoft (7.08%).
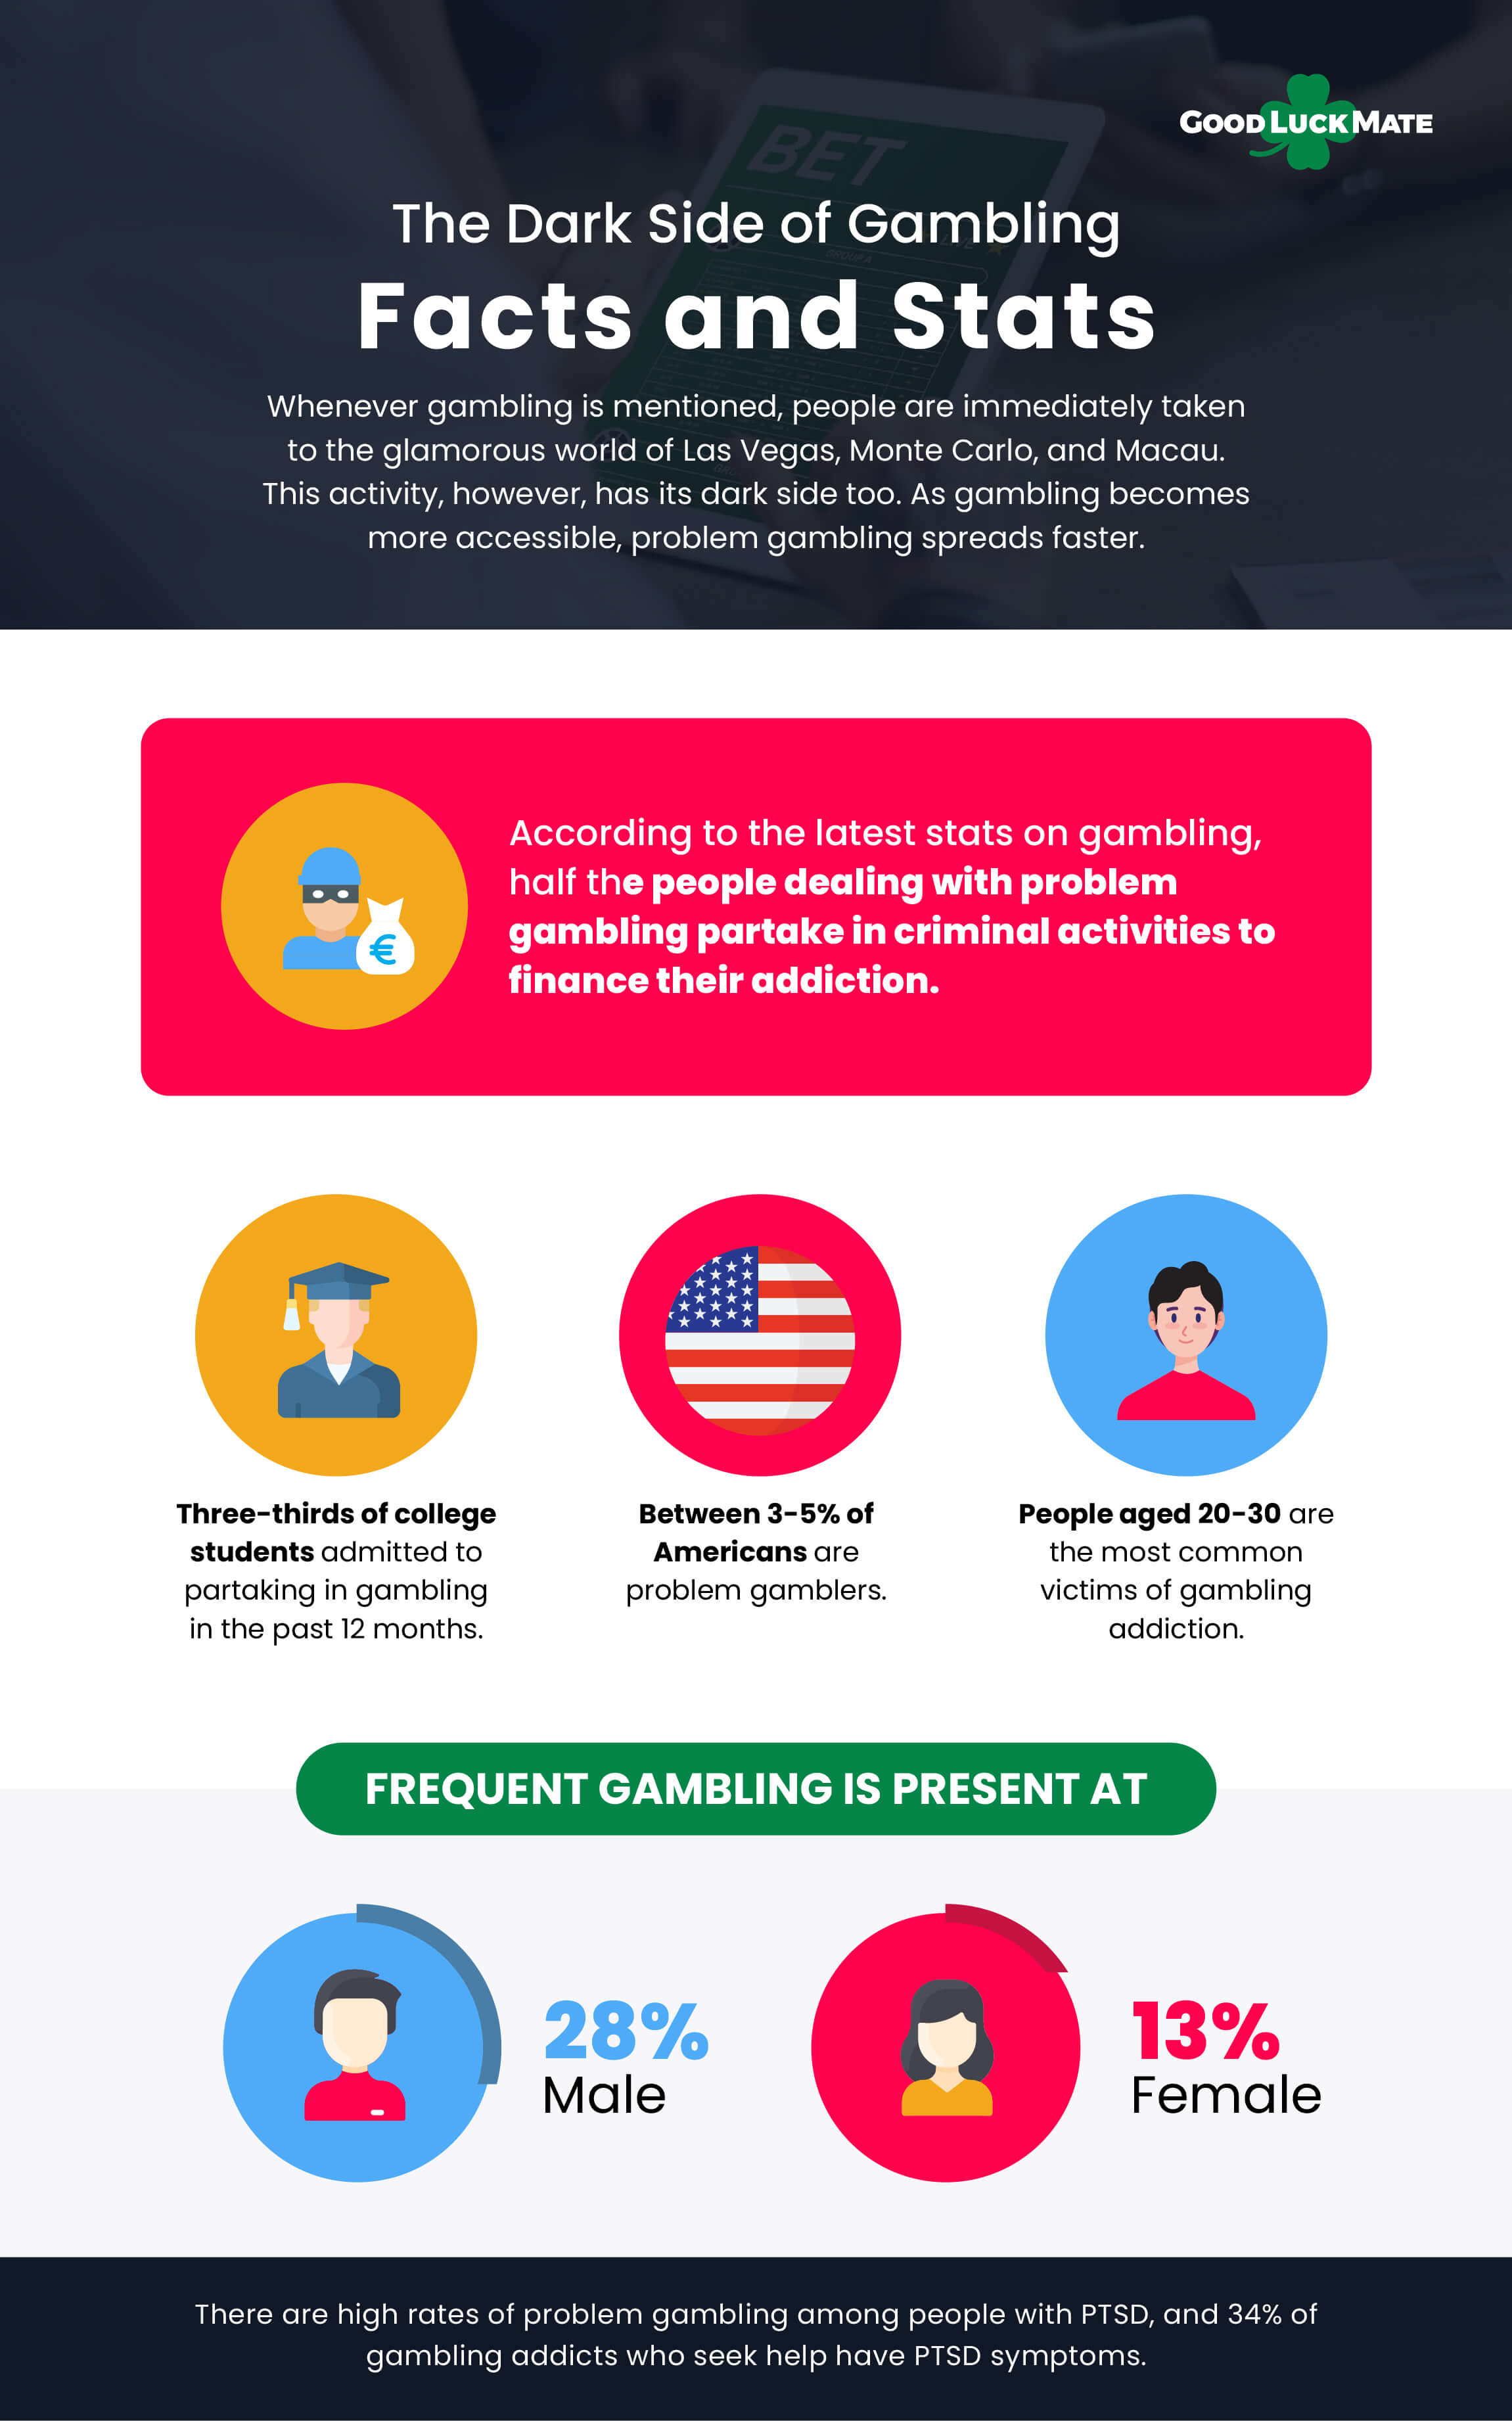
The Dark Side of Gambling – Facts and Stats
Whenever gambling is mentioned, people are immediately taken to the glamorous world of Las Vegas, Monte Carlo, and Macau. This activity, however, has its dark side too. As gambling becomes more accessible, problem gambling spreads faster. Some scary gambling addiction statistics show how this issue doesn’t discriminate against anyone.
- According to the latest stats on gambling, half the people dealing with problem gambling partake in criminal activities to finance their addiction.
- Three-thirds of college students admitted to partaking in gambling in the past 12 months.
- People aged 20-30 are the most common victims of gambling addiction.
- There are high rates of problem gambling among people with PTSD, and 34% of gambling addicts who seek help have PTSD symptoms.
- Youth gambling statistics reveal that college students have more than 50% higher chances of developing problem gambling issues.
- Between 3-5% of Americans are problem gamblers.
- Frequent gambling is present at 28% of male gamblers and 13% of female gamblers.
Gambling FAQs
 Gambling FAQs
How Many People Gamble in the World?
The latest stats show that about 26% of the global population partakes in gambling. This means that the number of people who gamble in the world is about 1.6 billion. Moreover, gambling statistics show that around 4.2 billion people worldwide partake in gambling at least once a year.
How Big Is the Gambling Industry?
According to an IBISWorld study, the land-based and remote gambling industry was $230.9 billion in 2021. This figure represents a significant jump of 14% compared to the gambling industry’s size seen in 2020.
What Country Has the Most Gamblers?
Australia has the most gamblers, where 6.8 million people or about 39% of the population gamble. The UK and Singapore also have a high rate of people who gamble with respective 46% and 52%, according to gambling statistics.
How Many People Gamble in the US?
About 24% of all Americans have visited a casino at least once, according to a 2007 study. In 2016, 64% of US consumers admitted to gambling in the past year, while 2% of them participated in online gambling. Since there were over 323 million people in the United States in 2016, it means that about 20.67 million of them gambled at least once.
What Percentage of Gamblers Win?
Statistics on gambling have shown that about 13.5% of gamblers win. However, these figures depend on many factors, one of those being what games are played and who’s playing them. For example, professional bettors tend to have a long-term winning rate between 53% and 54%.
How Much Does the Average Gambler Lose?
The average gambler in the United States spends about $261 on lottery tickets and casino games. About $6.6 billion are lost on pokies within a year. An additional $6.62 billion is lost on poker machines in clubs and pubs.
Bottom Line
Gambling is here to stay, and all these trends and facts support this. Still, with the rise of online and especially mobile gambling, it’s interesting to see how these latest gambling statistics will evolve in the next few years. It’s a question of time when these two sectors will overpower land-based gambling. But still don’t expect brick-and-mortar casinos to give up just yet, considering that what they offer goes beyond playing games.
Sources: IBISWorld, OPJ, Statista, Statista, Gov.ie, Newzoo, Gambling Commission, 888, OPUS-ULETH, Calgary Dream Centre, Queensland Government, DIA, Market Research, Statista, Legislative Council Secretariat, National Gambling Board of South Africa, NOIPolls, GeoPoll, Gambling Commission, Rutgers, NCBI, nextavenue, PXPFinancial, PRNewswire, Market Research Future, NCPG, UNCW, Addictions, Buffalo.edu


 Guide")


 Guide")
Our casino experts have tried and tested all aspects of each and every casino, so you can feel confident when signing up.