
GoodLuckMate's UK Gambling Survey
In late 2021, GoodLuckMate conducted a survey focused on UK iGaming consumers. We surveyed participants on their familiarity with the country’s gambling laws, alongside their gambling habits, frequency, and more. This proprietary data should provide readers with more insights on when, how, and why UK consumers partake in gambling. It will also give information on preferred gambling devices, views on land-based versus online gambling preferences, typical deposit amounts, etc. Below, we have lots of interesting trends for both professionals in the industry and fellow players. So, we invite you to stay with us on this journey and discover the latest gambling habits of UK consumers.
Methodology for Key Sources
The findings in this report are based on one source – a survey conducted by SmartSurvey on behalf of GoodLuckMate.com.
These are the details regarding how we collected the data and who participated in our survey:
- A survey prepared by GoodLuckMate and conducted by SmartSurvey on our behalf.
- A nationally representative sample of 928 adults aged 18+ and based in the UK.
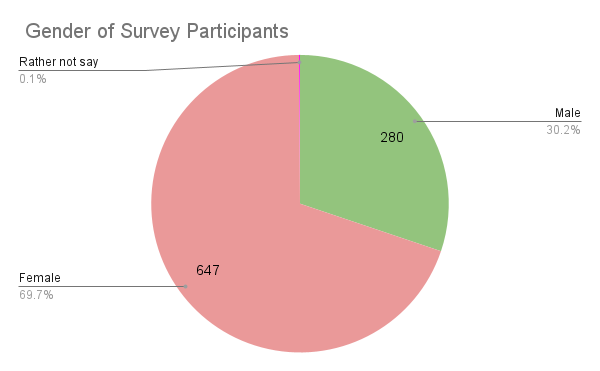
- Among all participants, 30.17% (280) were male, 69.72% (647) were female, and 0.11% (1) chose not to respond.
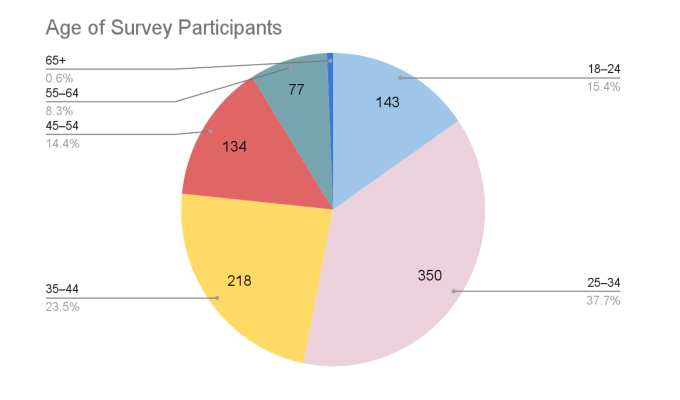
- As for the age representation, 15.41% (143) of participants were aged 18–24, 37.72% (350) were 25–34, 23.49% (218) were 35–44, 14.44% (134) were 45–54, 8.30% (77) were 55–64, and 0.65% (6) were 65+.
- Focus on UK adults who gamble online, offline, or both.
- The survey was conducted in Q4 of 2021.
A complete list of all survey questions can be found at the bottom of this page.
Note for the reader – only a single respondent chose not to state their gender, therefore reducing this demographic’s statistical significance. As such, this gender group will be omitted from this survey’s interpretations related to gender, and therefore the gender demographics won’t add up to 100%.
Key Takeaways From Our GoodLuckMate UK Gambling Survey
- 90.09% of the respondents believe they are familiar with the legal status of gambling in the UK.
- 55.50% of those familiar with the UK's gambling laws don’t find the legislation outdated.
- 56.36% typically gamble on the weekends.
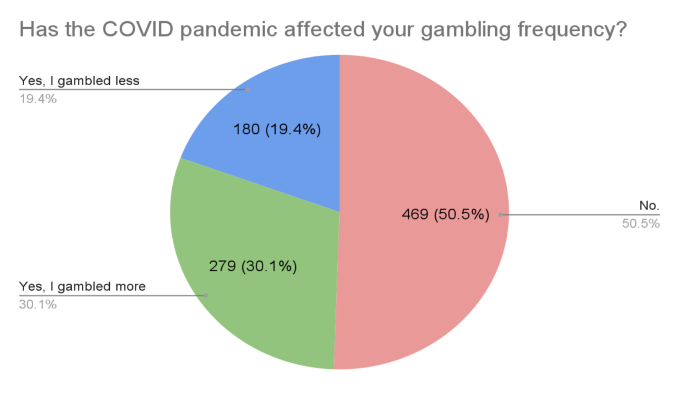
- For half the respondents, COVID-19 didn’t have any effect on their gambling frequency.
- Over one-third of gamblers partake in the activity weekly.
- Over 90% of consumers have never had an issue or a dispute with a casino.
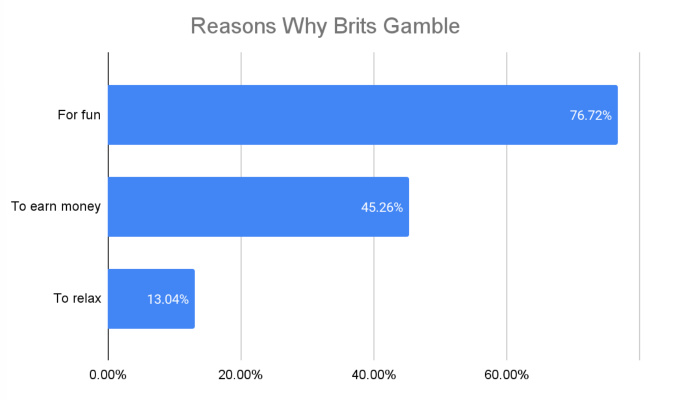
- Over two-thirds of gamblers gamble for fun.
- Slots are the most popular casino game.
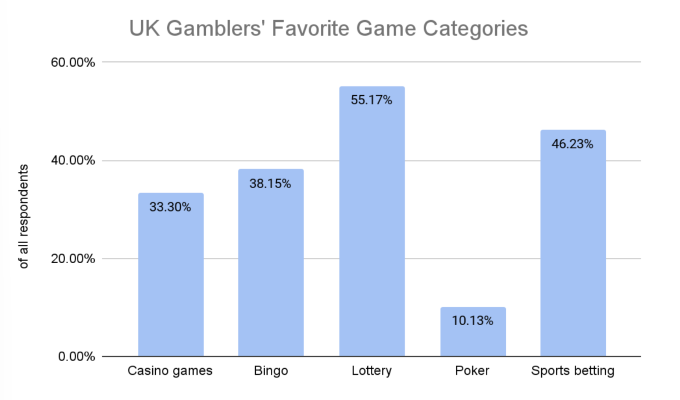
- Lottery and sports betting are the most popular game categories.
- Two-thirds of gamblers use online casino bonuses, of which free spins are the favorite type.
Demographic Profile of Gamblers in the UK
Among respondents who chose to reveal their gender, 69.72% identified as female and 30.17% as male. Only one participant (0.1%) decided not to disclose this information. So, it’s fair to say that more than two-thirds of the survey participants were female.
Accounting for over one-third (37.72%) of respondents, those aged 25–34 make up the dominant age group. The second-largest age consists of 35–44-year-olds, accounting for 23.49% of survey respondents. Those aged 18–24 and 45–54 make up 15.41% and 14.44% of respondents, respectively. The survey has fewer respondents from the 55–64 age group, comprising 8.30% of the total sample size, while those aged 65 or older account for a mere 0.65% of all survey respondents.
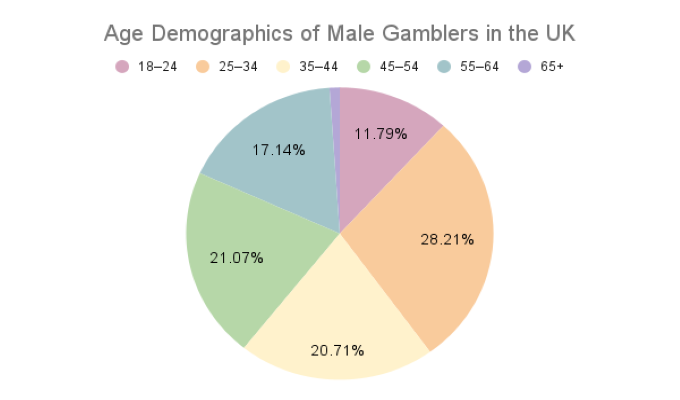
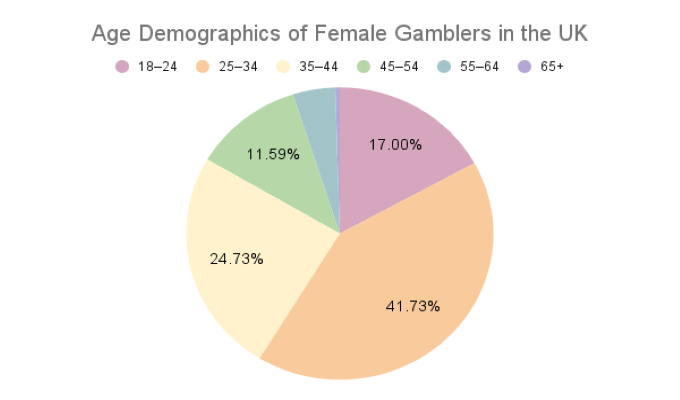
 Further analysis of the gamblers’ gender and age group produces some interesting findings, as seen in the charts below. For example, while the largest age group for both genders was 25–34, the difference in percentages is surprising. 41.75% of female gamblers were aged 25–34 compared to only 28.21% of male gamblers.
 Below, we have the age demographics of female UK gamblers, too.
UK Gamblers and Regulation
Most respondents, 90.09% (836) to be precise, believe they are familiar with the legal status of gambling in the UK. The remaining 9.91% (92) said that they weren’t familiar with the legal status of the activity.
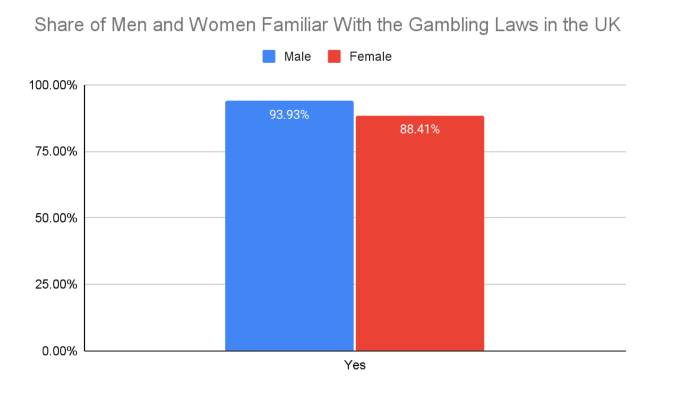
Among male respondents, 93.93% (263) expressed their awareness regarding gambling regulations in the country, compared to 88.41% (572) of women, pointing to a slight difference between genders and their familiarity with the legal status of gambling in the country.
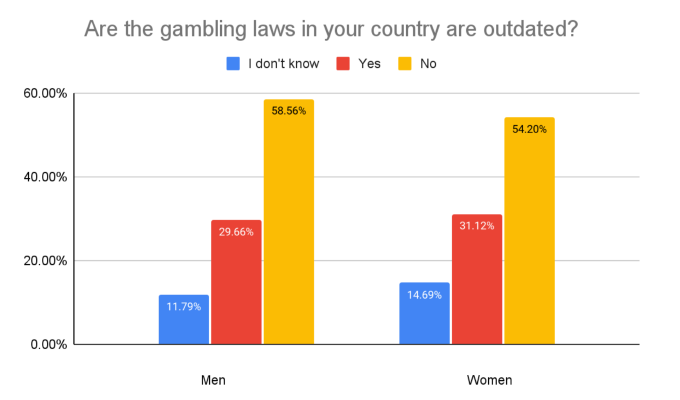
 Among all participants who said they were familiar with the UK's gambling laws, more than half (55.50%; 464) think that the country's legislation isn't outdated. By contrast, nearly one-third (30.74%; 257) said that the laws were outdated. Only 13.76% (115) didn't know whether the UK's gambling regulations were outdated.
Out of those who are familiar with the legal status of gambling in the UK, slightly more women (14.69%) don’t know whether those regulations are outdated or not compared to men (11.79%). A similar trend appears when it comes to respondents who think that gambling laws in the country are outdated (31.12% of female respondents vs. 29.66% of male ones).
 In terms of age demographics, over 90% of those aged between 18 and 44 said they’re familiar with the legal status of gambling in the UK. The corresponding figure for the 45–64 age group stands at 86%, dropping to a little over 66% among those aged 65 or older. Below, you can see how the respondents from each age group answered.
Data on Gambling Frequency
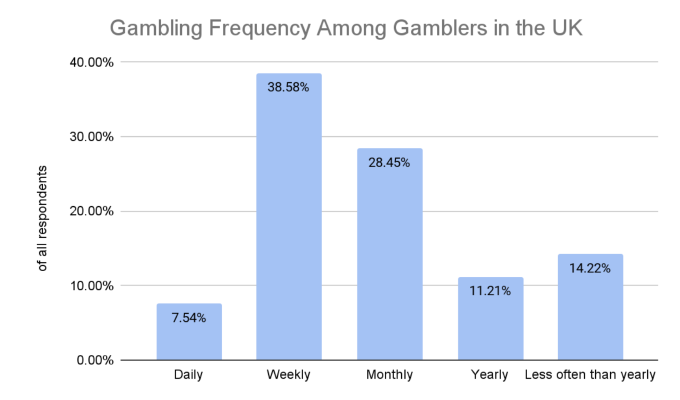
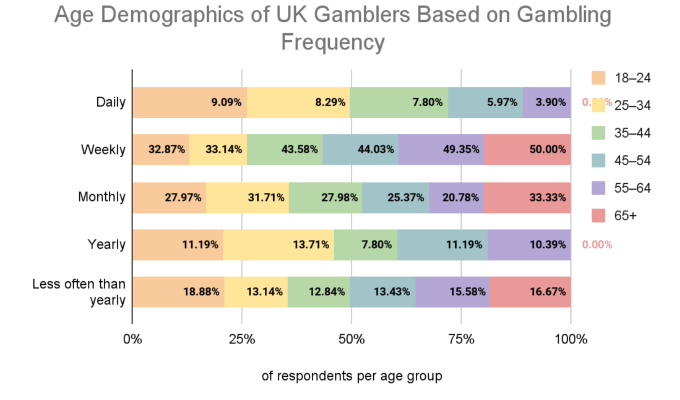
The majority of respondents (38.58%) say they gamble on a weekly basis, while 28.45% say they do so monthly.
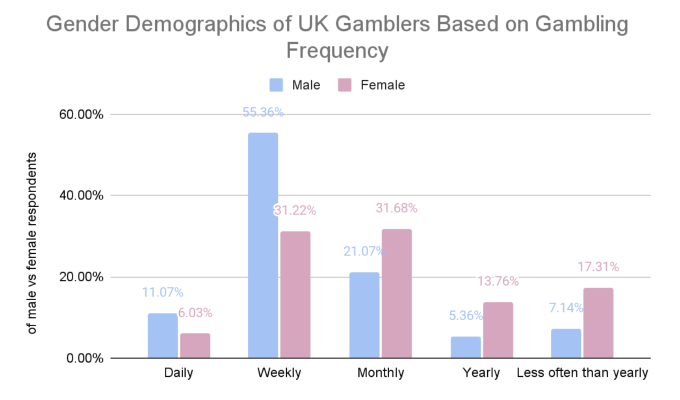
 The majority of male respondents (55.36%) say they gamble weekly, followed by those who do so monthly (21.07%). 12.5% of men gamble yearly or less often than that, while 11.07% do so daily.
When it comes to female respondents, nearly equal portions gamble either weekly or monthly (31.22% and 31.68%, respectively). Only 6.03% of women say they gamble daily, while 31.07% gamble yearly or less often than that.
 Averaging a little less than 6% across all age groups, daily gambling is the least popular when observing respondents’ age demographics. The majority of respondents gamble on a weekly basis, as agreed by an average of just over 42% of respondents across all age groups.
Monthly gambling follows, at an average of a little less than 28%. An average of 15% of respondents across all age groups agree they gamble less often than yearly, while the yearly gambling frequency adds up to an average of 9% across all age groups, making it the least popular.
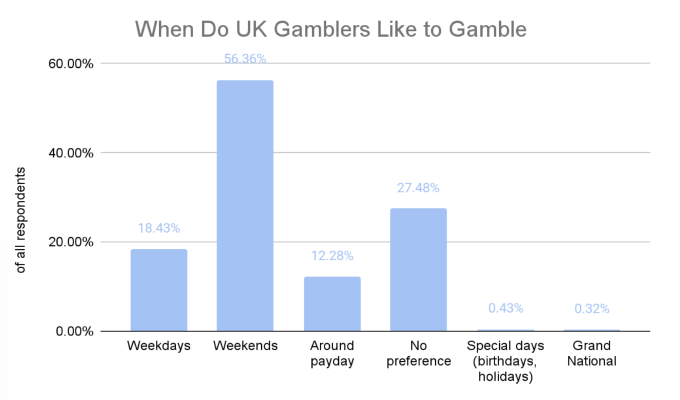
 The weekend is the most popular period of the week for gambling. Among the participants in our GoodLuckMate gambling survey, 56.36% selected the weekends as the most typical time of the week for gambling. 18.43% claimed to gamble on weekdays, while 12.28% typically gamble around payday. For 0.32%, gambling was typical on special days like birthdays or celebrations and for the Grand National.
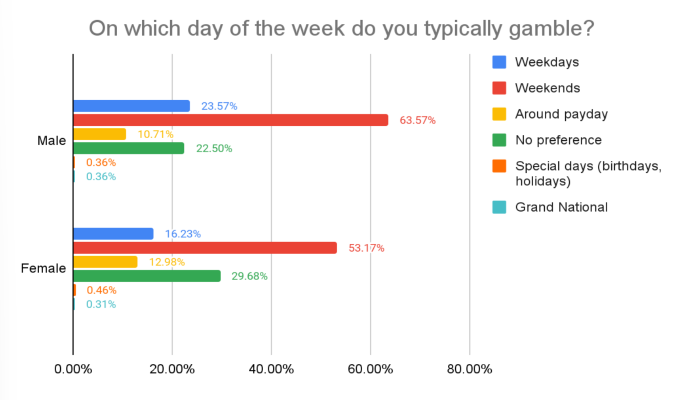
Gambling on weekends is most popular in both gender groups, with 63.57% of men and 53.17% of women choosing to gamble on Saturdays and/or Sundays. A higher portion of male respondents (23.57%) agree they gamble on weekdays compared to female ones (16.23%). Conversely, 29.68% of women and 22.50% of men state they have no preference regarding the days on which they choose to gamble.
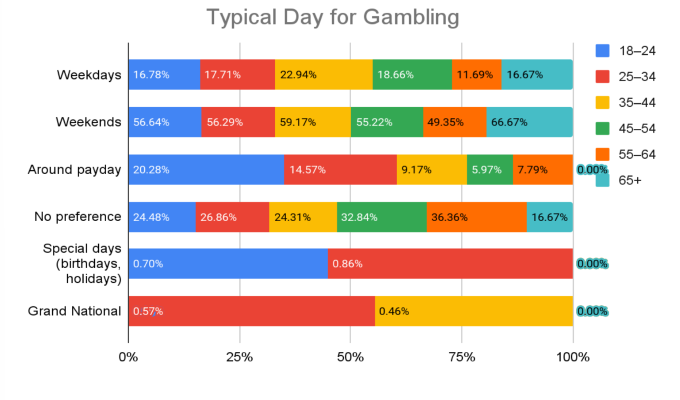
 Averaging around 57%, gambling on weekends is also most popular across age groups. An average of nearly 27% claim to not have any preference across all age groups, while an average of around 17% of respondents of all age groups like to gamble daily.
Interesting findings are revealed when it comes to age differences in those who opt to gamble around payday. Namely, around 17% of those aged 18–34 choose to gamble around payday, and the same applies to a little over 7% of those aged 35–64.
COVID-19 and Gambling Frequency
And you must be wondering whether and how the global COVID-19 pandemic has affected consumers’ gambling frequency. In the next section, we have some data on the topic you will surely find interesting.
COVID-19 and the pandemic didn't affect the gambling frequency of half (50.54%) of the respondents. However, nearly one-third (30.06%) claimed they gambled more often during the pandemic, whereas 19.40% gambled less frequently.
The above figures are pretty consistent across the gender and age groups. For most respondents, regardless of gender and age, the pandemic didn’t have a drastic impact on their gambling.
Data on Gambling Preferences
Most UK consumers gamble for fun. In fact, just over three-quarters of (76.72%) respondents selected this option. Gambling to earn money was also selected as a motivation by 45.26% of respondents. Finally, only 13.04% of participants claimed that they gamble to relax.
 And what about the game categories? Well, let’s see!
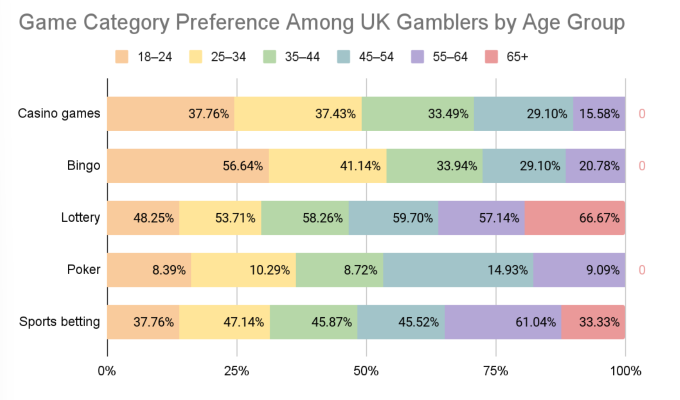
Even with all those amazing slots and table games, UK consumers seem to simply love the lottery. In fact, in a multi-choice question (meaning participants could select multiple answers) regarding favorite game categories, 55.17% of respondents chose the lottery as their top pick. Two other popular categories are sports betting and bingo. They were selected by 46.23% and 38.15% of the participants, respectively. Casino games were chosen by 33.30%, and, finally, poker was a favorite game category for only 10.13%.
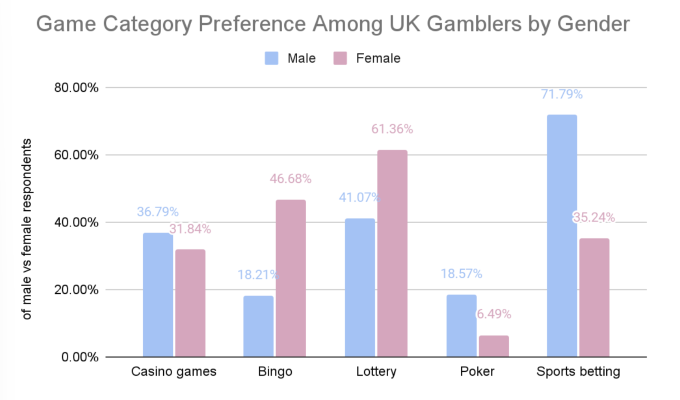
 While both male and female respondents show similar preferences when it comes to casino games, there are staggering differences when it comes to other game categories. About 46.68% of women selected bingo as their favorite game category, as opposed to 18.21% of men. The proportions of female and male respondents who opted for lottery games as their favorite stand at 61.36% and 41.07%, respectively.
An opposite dynamic occurs when it comes to poker and sports betting. Namely, 18.57% of men chose poker as their favorite game category as opposed to a mere 6.49% of women. Another 71.79% of male respondents agree sports betting is their favorite game category, compared to only 35.24% of female ones.
 Lottery is the most-preferred game category when observing responders by age groups. Sports betting ranks second, followed by bingo and casino games. Poker is the least popular game category across age groups.
Surprisingly, bingo is the most popular among those aged 18–24 with 56.64% of respondents in this age group selecting it as their favorite game category, while only 8.39% selected poker. Across age groups, poker is most popular among those aged 45–54, as 14.93% of them opted for it as their favorite game category.
Those aged 25–54 show similar preferences when it comes to their favorite game categories. Lottery reigns supreme here, at an average of 57% of this age demographic, followed by sports betting at around 46%. Bingo ranks third at a little below 35%, followed by casino games at a little over 33%.
At 61.04%, sports betting is the most popular game category among those aged 55–64, closely followed by lottery at 57.14%. 15.58% and 20.78% of this demographic group selected casino games and bingo, respectively, as their favorite game categories, while a mere 9.09% opted for poker.
Those aged 65 or over either have lottery or sports betting as their favorite game categories, at 66.67% and 33.33%, respectively.
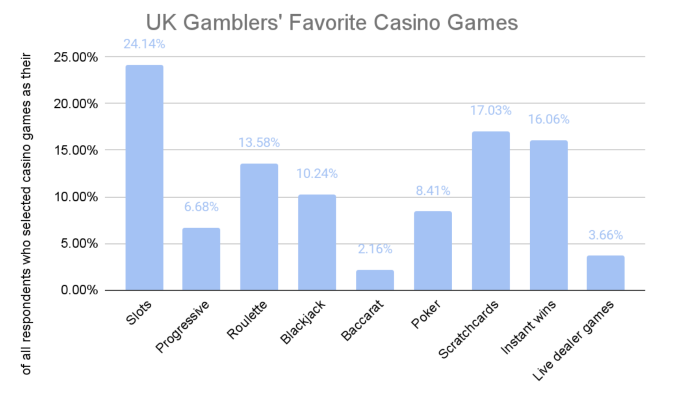
Favorite Casino Games
Another question reveals an interesting yet unsurprising trend about the favorite casino games among those whose stated the casino games category was their favorite. Namely, slots, scratchcards, and instant wins turned out to be the most adored casino games among UK gamblers. By contrast, the least loved games were baccarat, live dealer games, and progressive jackpots.
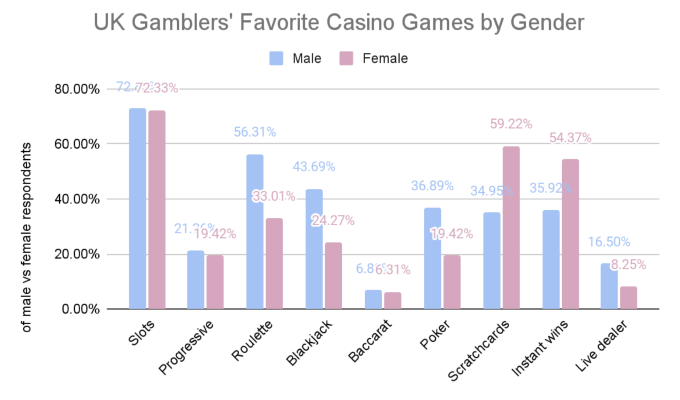
 Slots, progressive jackpots, and baccarat seem to be the only casino games with similar trends among male and female respondents.
Casino games which men like more than women include roulette (a favorite of 56.31% of male vs. 33.01% of female respondents), blackjack (a favorite among 43.69% of men vs. 24.27% of women), poker (36.89% of male vs. 19.42% of female respondents), and live dealer games (favorites of 16.50% of men vs. 8.25% of women).
Our data points to the opposite dynamic regarding scratchcards and instant wins. 59.22% of female respondents, as opposed to 34.95% of male ones, selected scratchcards as their favorite games. The same applies to 54.37% of women vs. 35.92% of men regarding instant win games.
You can find the exact figures in the chart below. Just please note that this was a multi-choice question, meaning participants could select more than one answer.
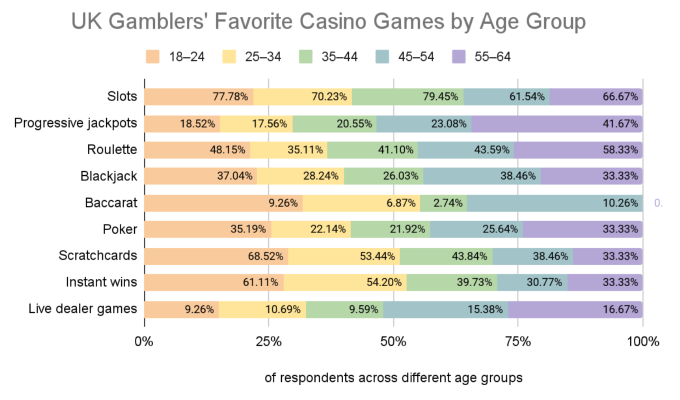
 Considering none of the respondents aged 65 or over selected casino games as their favorite game category, this demographic isn’t considered in our interpretation of respondents’ favorite casino games by age group.
Online slots are by far the most popular casino game in this regard, ranging between 79.45% as favorites of those aged 35–44 to 61.54% among those in the 45–54 age group. Scratchcards rank second, with their popularity as casino game favorites dropping as the age groups increase (from a peak of 68.52% among 18–24-year-olds to 33.33% among 55–64-year-olds).
Roulette ranks third, being one of the favorite casino games of 48.15% of those aged 18–24, with its popularity dropping to 35.11% among those aged 25–34, only to gradually increase along with more mature age groups, peaking at 58.33% of those aged 55–64.
Instant wins take the fourth place, showing an inversely proportional trend as age groups increase, similar to the one we found with scratchcards. Their popularity as favorite casino game peaks at 61.11% among 18–24-year-olds and drops to 33.33% among 55–64-year-olds.
As one of the respondents’ favorite casino games, blackjack is most popular among those aged 18–24 and 45–54, and the same applies to poker in the 18–24 and 55–64 age groups. Progressive jackpots’ popularity increases in direct proportion with age groups; from being a favorite casino game among 18.52% of those aged 18–24 to peaking at 41.67% of 55–64-year-olds.
Live dealer games are the second-to-least popular casino game favorites across different age groups, being chosen by around 10% of those aged 18–44 and 16% of 45–64-year-olds. The least favorite casino game when observing respondents’ choices by age group is baccarat. Not being selected as one of the favorite casino games by anyone in the 55–64 age group, its popularity ranges from as low as 2.74% of 35–44-year-olds to its peak of 10.26% of those aged 45–54.
VR Gambling Trends and Preferences
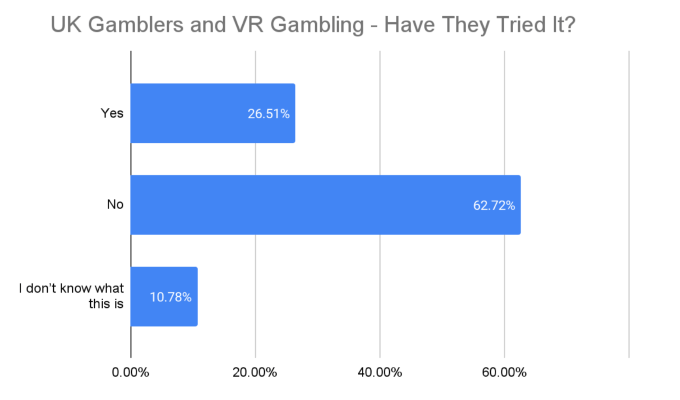
Virtual reality (VR) gambling is expected to be the next big thing in iGaming as players look for authentic experiences. Yet 10.78% of UK gamblers don't even know what VR gambling is. Nearly two-thirds of them (62.72%) haven't tried it, and only 26.51% of the survey participants have tried VR gambling.
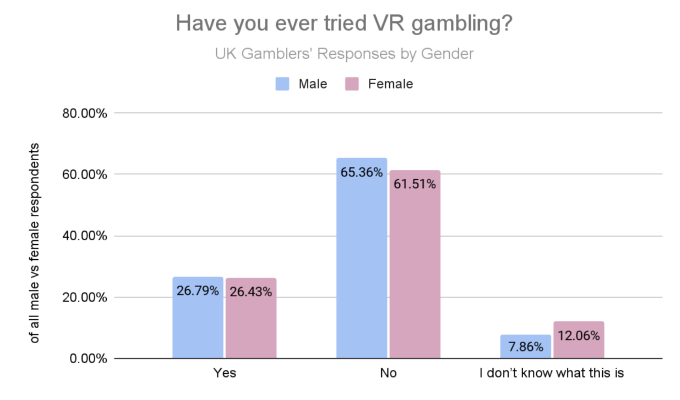
The figures between male and female respondents show similar trends, with a slightly higher proportion of men saying they haven’t tried it and a 5% more women admitting to not knowing what VR gambling is.
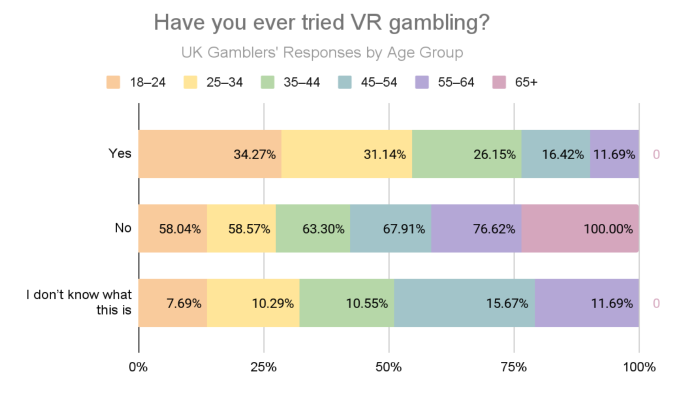
 As expected, VR gambling awareness and usage are inversely proportional to the increase in age groups. We noted interesting data when it comes to respondents aged 65 or older, all of whom had not tried it; however, none said they didn’t know what it is.
 Online vs. Land-Based Gambling Preferences and Practices
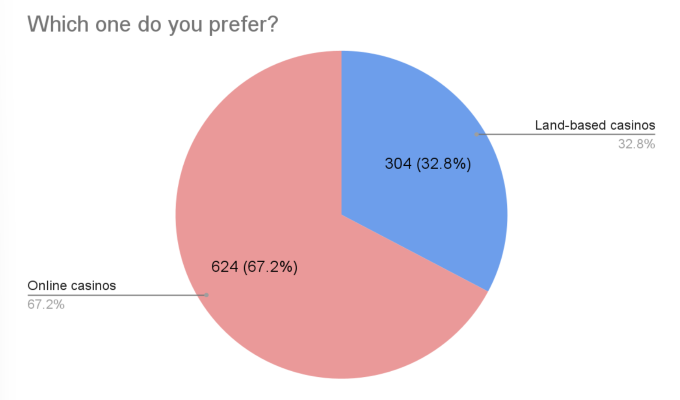
While VR gambling still hasn't spread as much as one would expect, online gambling certainly has. Among the people who completed our survey, 67.24% said they preferred online casinos over land-based casinos. This means that only one-third (32.76%) find brick-and-mortar casinos the better option.
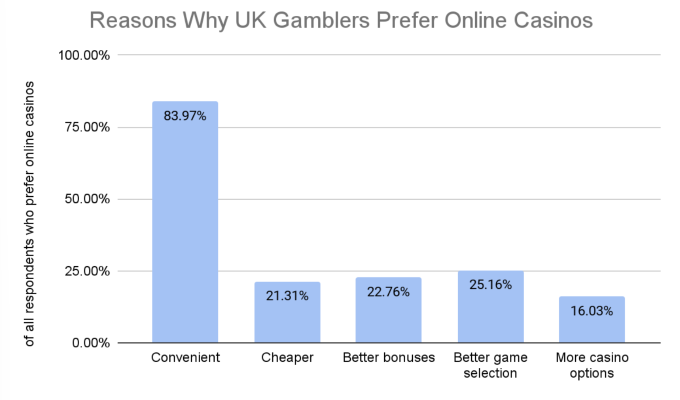
 But what's the deal with online casinos? Why do UK players like them? Well, in a multi-choice question, most respondents (83.98%) said that internet casinos are convenient. They also offer a better game selection (25.16%) and better bonuses (22.76%). Finally, for 21.31% of the respondents, iGaming was cheaper, and for 16.03%, the vast number of casinos played its role too. After all, new online casino sites pop up every month. So, players can constantly try out something fresh.
Online Gambling and Bonuses
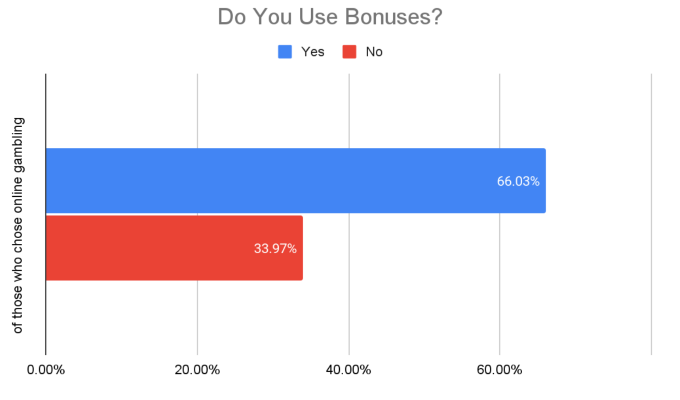
And while better bonuses are mentioned, how many people actually use them? Well, it seems that two-thirds of online gamblers, 66.03%, use online casino bonuses. The remaining 33.97% avoid them.
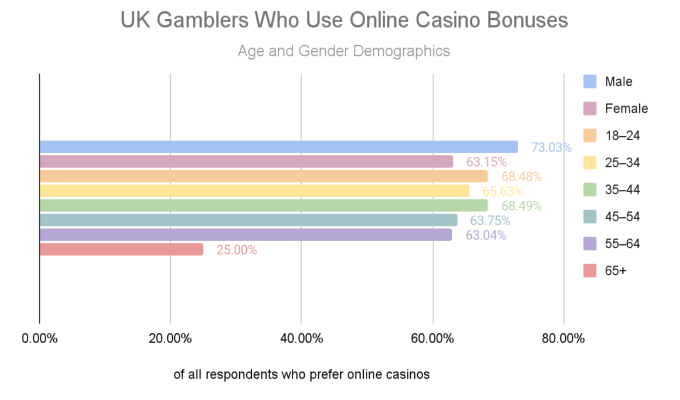
 When observing respondents’ responses by gender, there is a ten percentage point difference between the proportion of men (73.03%) and women (63.15%) who use bonuses at online casinos. In terms of age groups, online casino bonus usage is equally and most prevalent among those aged 18–24 and 35–44, while only a quarter of those aged 65 or older use bonuses at online casinos.
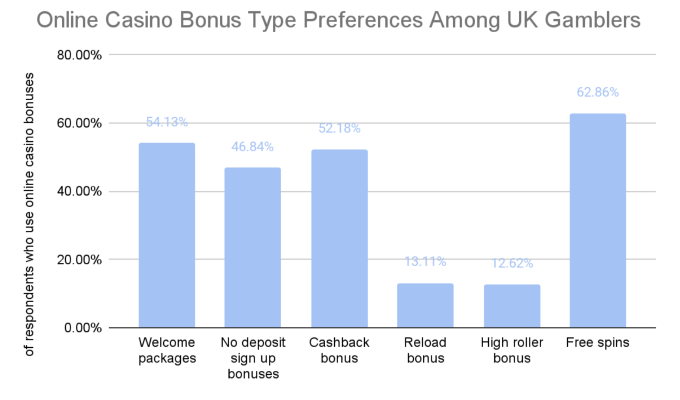
 Free spins are by far the most popular type of bonus among UK gamblers, with 62.86% of respondents opting for them. Welcome packages rank second (54.13%), closely followed by cashback bonuses (52.18%). Reload and high-roller bonuses are among the least popular types.
Players love perks and rewards that make them feel appreciated. That's why VIP and loyalty schemes exist. But what perks do online casino members love the most?
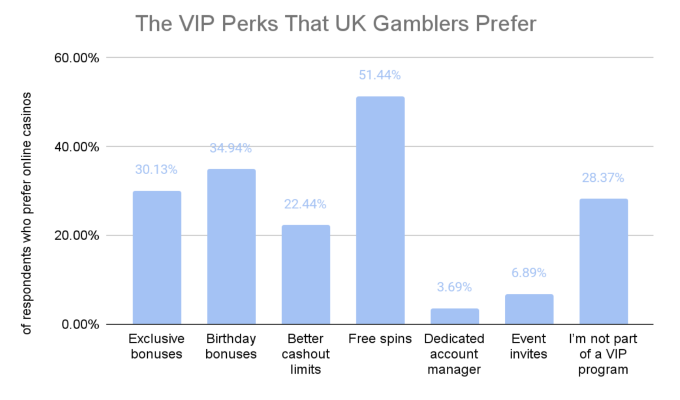
28.37% of respondents who prefer gambling at online casinos aren’t part of a VIP program. The reasons for this may vary as some people don't play often enough, or they don't visit the same gambling operator all the time.
Of the remainder, the majority (51.44%) prefer free spins as a VIP perk. Birthday and exclusive bonuses follow, being VIP perks of preference for 34.94% and 30.13% of respondents, respectively. Another 22.44% prefer better cashout limits, while event invites and having a dedicated account manager are the least-preferred VIP program perks.
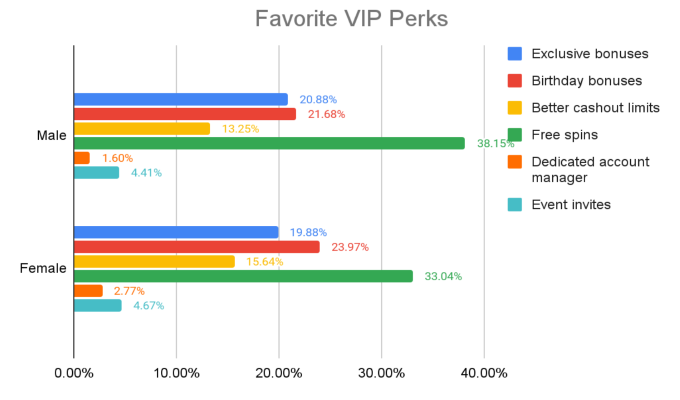
 And what about VIP perks preferences by gender? Well, among those men and women who are a part of a VIP program, free spins seem to be the most attractive perk. While the difference in the percentages was relatively small, the trends seem identical. After free spins, the top VIP benefits among UK gamblers, regardless of gender, are birthday bonuses, exclusive bonuses, and then better cashout limits.
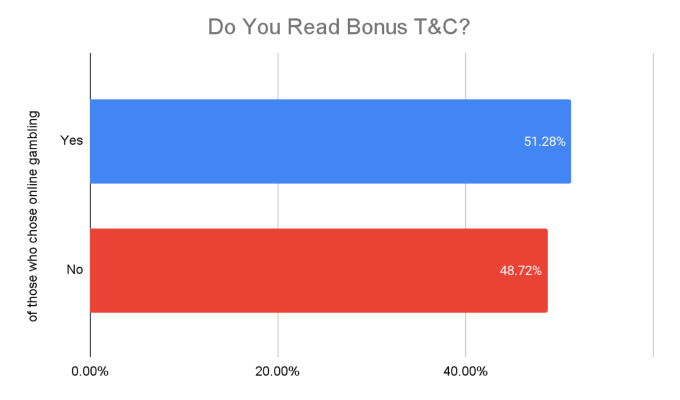
 Our GoodLuckMate experts always advise our readers to carefully read the terms and conditions and bonus rules before signing up with casinos. We can only hope that the advice is taken seriously, as unfair T&C can ruin any iGaming experience. That's why we asked online gamblers in the UK whether they read the fine print and got surprisingly positive results. Specifically, 51.28% of the respondents claimed to read the casino and bonus T&C, while 48.72% didn't bother with that.
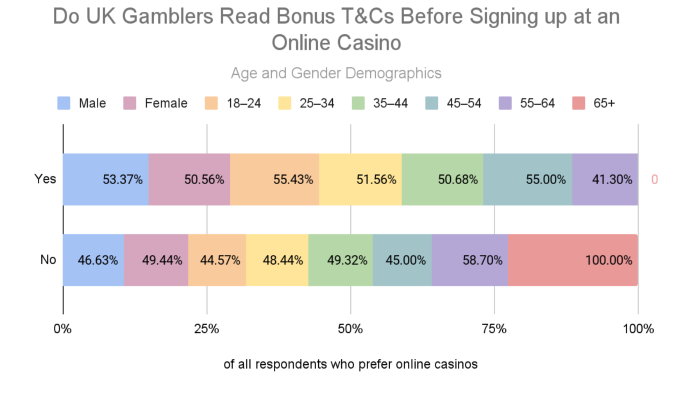
When looking at respondents’ gender demographics, men emerged as slightly more concerned with this, with 53.37% of them reading bonus T&Cs before signing up at a casino, in comparison to 50.56% of women.
In terms of age groups, at around 55% each, those aged 18–24 and 45–54 rank first when it comes to reading bonus terms and conditions prior to signing up with an online casino, followed by 25–44-year-olds at around 50%. A little over 40% of those aged 55–64 say they read bonus T&Cs before registering at a casino, while none of those aged 65 or older said the same.
Online Gambling Devices
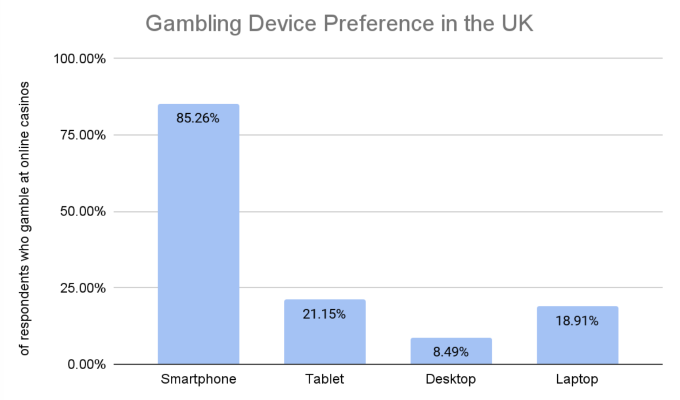
Smartphones have become the most popular device for gambling online. In a multi-choice question about the devices typically used for iGaming, 85.26% of respondents selected this option. Next came tablets (21.15%), laptops (18.91%), and desktops (8.49%).
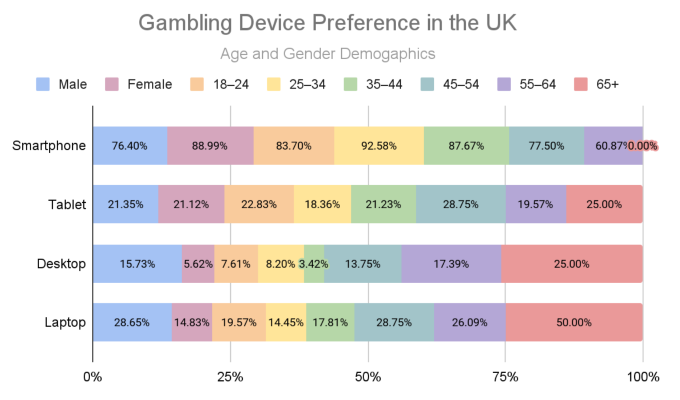
 Women are much bigger fans of gambling on smartphones than men (88.99% vs. 76.40%). While it’s a tie when it comes to tablets, male respondents seem to like gambling on desktops and laptops more than women (15.73% vs. 5.62% and 28.65% vs. 14.83%, respectively).
When observing age demographics, the biggest fans of smartphone gambling are surprisingly not the youngest cohort, but those aged 25–35, 92.58% of whom said they liked using these devices to gamble. While none of the respondents aged 65 or over agreed to gambling on smartphones, they are the dominant age demographic when it comes to gambling on desktops and laptops, while tablet gambling is most popular among those aged 45–54.
Online Gambling Payment Methods
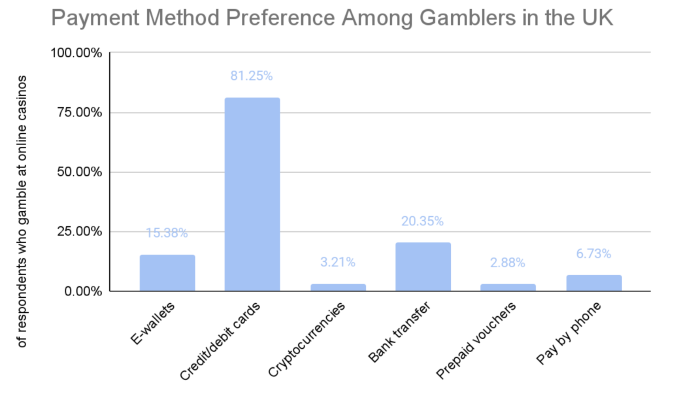
To gamble for real money, one must upload cash to their online casino account. So, we asked the survey participants about their preferred ways of topping up gambling accounts. These are the responses we got to the multi-choice question.
It's interesting to note that credit and debit cards are the preferred payment method among UK online gamblers, as agreed by 81.25% of respondents who gamble at online casinos. However, credit card gambling was banned in the country in April 2020.
Surprisingly, bank transfers were the second-best option (20.35%), followed by e-wallets (15.38%). On the other side of the spectrum, pay-by-phone (6.73%), cryptocurrencies (3.21%), and prepaid vouchers (2.88%) round the list of the least preferred payment methods.
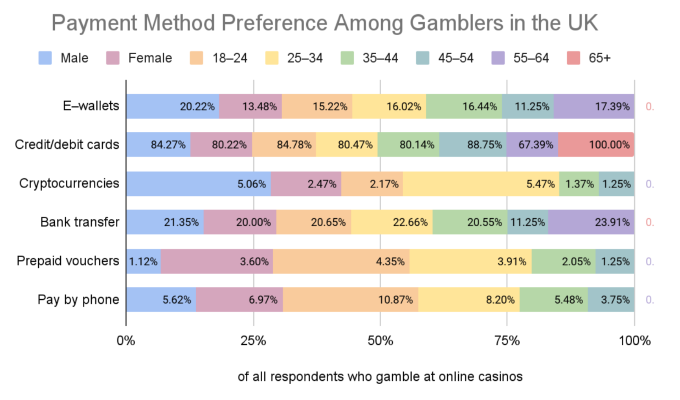
 When examining payment method preferences by gender, men emerge as much bigger fans of e-wallets and cryptocurrencies than women, more of whom preferred prepaid vouchers than men.
Looking at age groups, 55–64-year-olds dominate bank transfers and e-wallets, but rarely use credit/debit cards as a payment method. For those aged 65 or over, credit/debit cards were the only preferred payment method. 25–34-year-olds emerged as the most dominant demographic when it comes to cryptocurrencies, and so did 18–24-year-olds with pay-by-phone as a preferred online casino payment method.
Remote Gambling and Customer Support
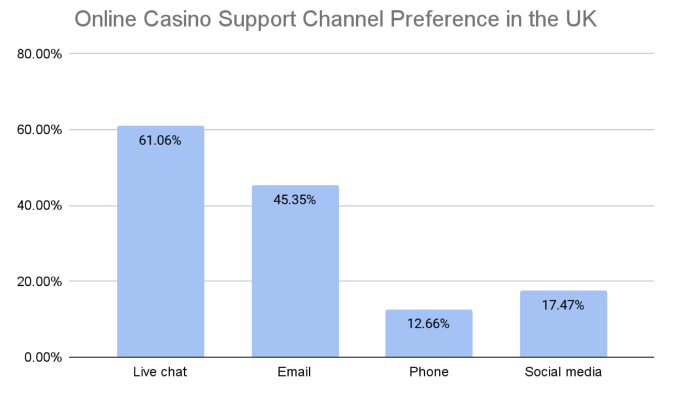
Customer support is essential for a pleasant and smooth iGaming experience. Yet, getting in touch is not always easy, and getting a response can take forever. That's why players from the UK prefer live chat support (61.05%), which is instant. In a surprising turn of events, email (45.35%) was greatly preferable to phone (12.66%). Social media is establishing itself as a favored customer care channel, and 17.47% of the respondents selected it as a preferred support method.
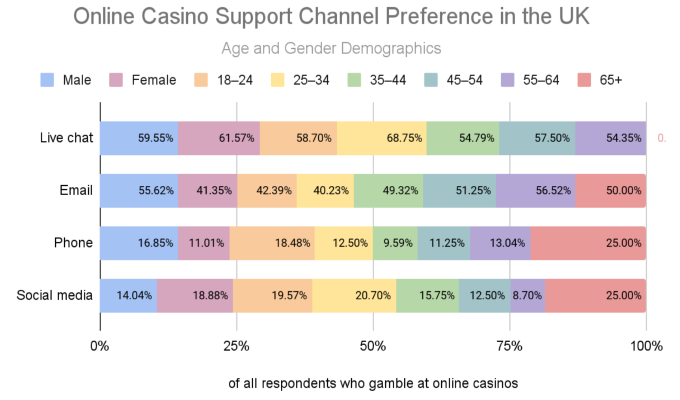
Looking at the age demographics of UK gamblers’ preference in online casino customer support channels, men prefer email support substantially more than women (55.62% vs. 41.35%). Those aged 25–34 stand out as the biggest live chat fans, with 68.75% opting for this support channel. A similar trend emerges with the 56.52% of 55–64-year-olds who opted for email during the survey. Those aged 65 stand out in the phone and social media category, with a quarter of respondents each opting for these channels as their most preferred ones.
Online Gambling and Location
Where UK players gamble the most is an exciting thing to discover. However, the responses may be anti-climatic as most of them (91.99%) said that they mostly gamble from their homes. As this was a multi-choice question, other selected options were out with friends (4.33%) and at work (2.56%). Nearly insignificant 0.80% and 0.32% selected while on public transport and other. Fortunately, not a single person selected “while driving” as an option.
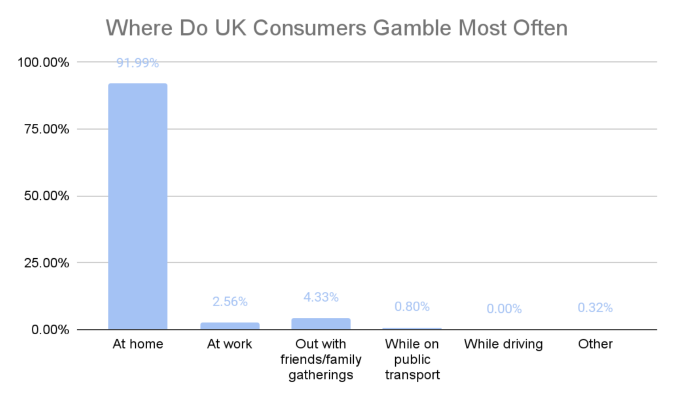
With such figures, the same trend is expected in the responses categorized by gender. Unsurprisingly, both men and women mostly gamble at home. This answer was prevalent across all age groups, as well.
Online Gambling and Licensing
Unlicensed gambling operators don't pay taxes, don't provide prompt support, and often have unfair terms and conditions. Moreover, even if you have an issue with them, you don't really have anywhere to complain or seek help from a third party. That's why we never promote gambling with unlicensed and unregulated online casinos.
It seems that most UK gamblers have understood the message as 91.51% of them never play at unlicensed gambling sites. 5.93% claimed that they didn't care about the licensing of a casino, while only 2.56% said they do play at unlicensed casinos.
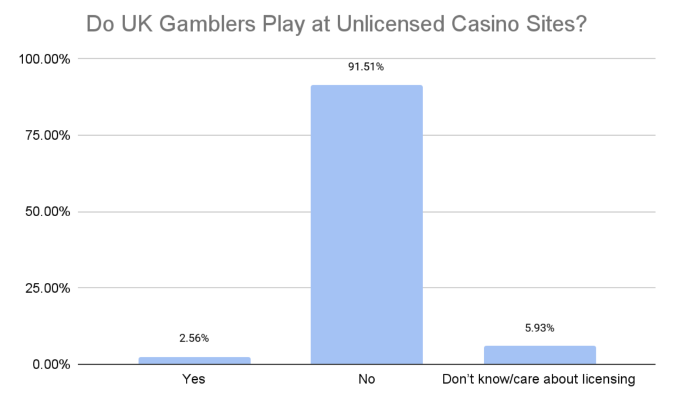
Once again, when focusing on what participants responded by gender and by age group, licensed operators are the main choice. In some age groups, 100% of respondents claimed to never play at unlicensed gambling sites.
This is a positive trend that we hope will remain in the years to come.
Land-Based Gambling
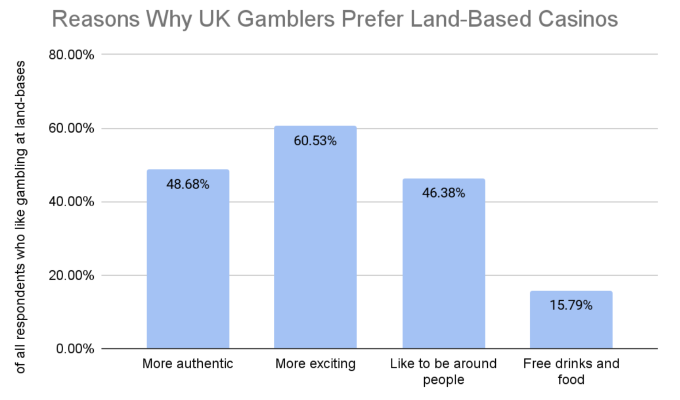
We learned what makes online casinos better in the eyes of the average UK gambler. But what about land-based casinos? Well, those who responded that they prefer brick-and-mortar gambling facilities find them more exciting (60.53%) and more authentic (48.68%). Moreover, 46.38% said they wanted to be around people, while 15.79% enjoyed the free drinks and food.
Deciding Where to Gamble – Habits and Trends
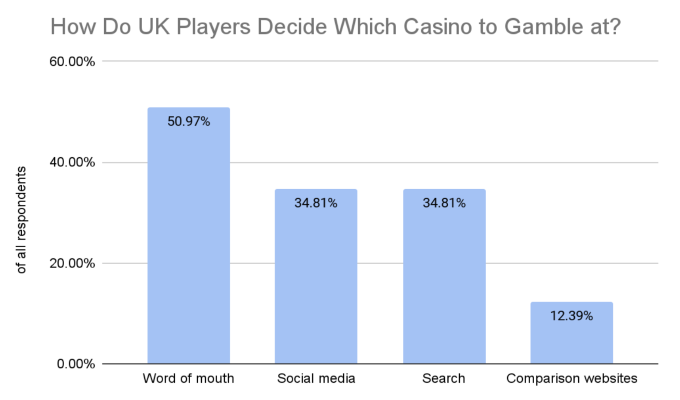
It's the digital era, and everyone's out there Googling reviews online, right? Well, not quite when it comes to online gambling. In fact, half the participants (50.97%) said that they decide where to play based on word of mouth. One-third (34.81%) get their recommendations via social media, while another third (34.81%) search the internet. Finally, only 12.39% claimed to read comparison websites.
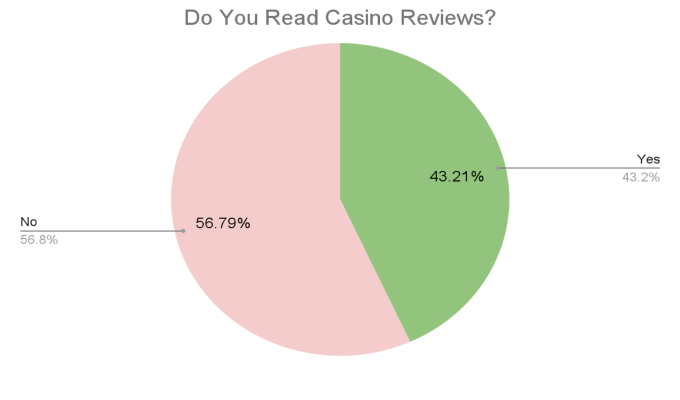
When asked whether they read casino reviews, a slightly larger share of the respondents (56.79%) said they do not. The remaining 43.21% claimed that they do read casino reviews.
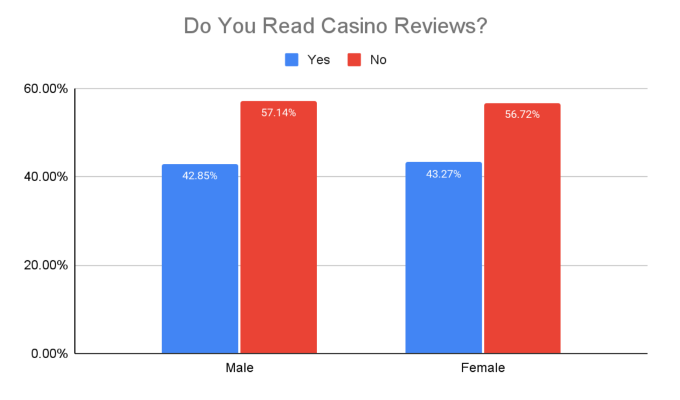
 Among the men, 42.85% said they read reviews, while among the ladies, this share was a tad higher at 43.27%.
Familiarity With Return To Player Percentage
The Return to Player (RTP) percentage is one of the most important pieces of information about a slot. This figure tells players how generous a game is and also reveals the house edge. Generally, playing games with a higher RTP is advisable, whereas the industry average is around 95%.
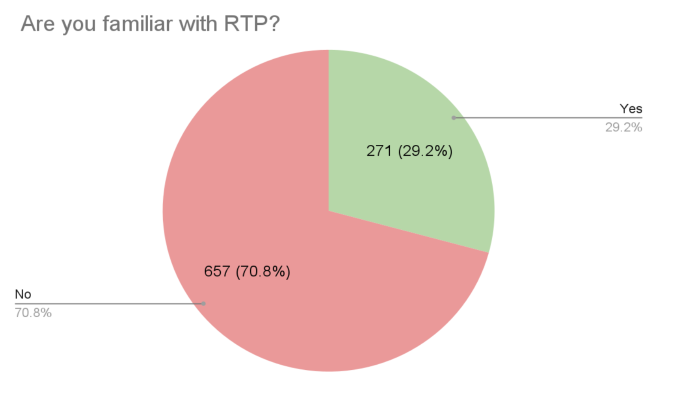
When we asked UK gamblers whether they are familiar with RTP and what it represents, however, a whopping 70.80% said they were not. Only 29.20% said that they were familiar with this important concept.
Deposit and Betting Habits
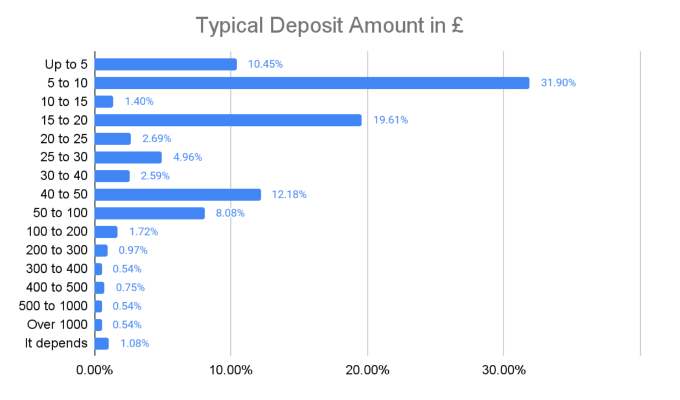
One fascinating question in our survey focuses on the typical deposit amount. The highest proportion of respondents (31.90%) deposits anywhere between £5 and £10. Those depositing £10–20 account for 21.01% of respondents, followed by those who typically deposit £40–50 at 12.18% and up to £5 at 10.45%.
A further 10.24% deposit £20–40, while the deposits of 8.08% of respondents typically range between £50 and £100. 3.99% agree they deposit £100–£500, with 1.72% staying in the £100–£200 bracket. Those usually depositing £500–£1,000 and over £1,000 account for 0.54% of survey respondents, each, while 1.08% answered ‘it depends’.
And what about the average single bet among UK gamblers? Do you think they play it safe with low stakes of a few pennies, or do they like to splash most of their playing funds?
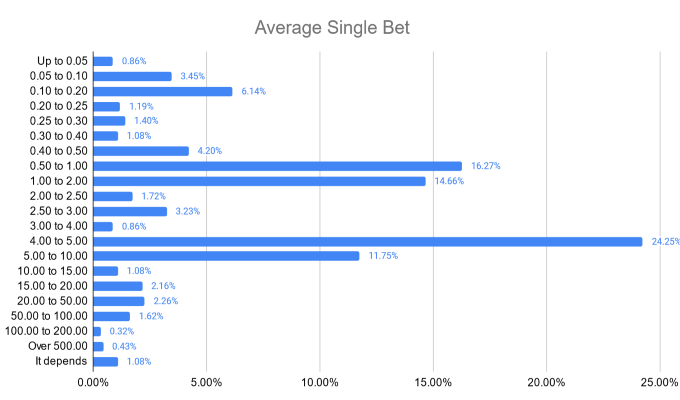
The majority of respondents (24.25%) said their average single bet typically stands between £4 and £5. The second-largest proportion (16.27%) were those who typically bet 50p–£1, followed by respondents whose single bets are typically in the £1–£2 range (14.66%). Another 11.75% agreed to their single bets typically varying between £5 and £10.
A total of 6.14% of respondents typically gamble with single bets in the 10p–20p range, while 4.20% do so within the 40p–50p bracket. A small share of 3.45% keep their average bets lower at 5p–10p, and 0.86% stick to average single bets below 5p.
The average single bet stands in the £50–100 range for 1.62% of respondents, while 0.32% bet between £100 and £200, and 0.43% go over £500 when it comes to the average single bet amount they like to gamble. The remaining 1.08% of respondents answered ‘it depends’.
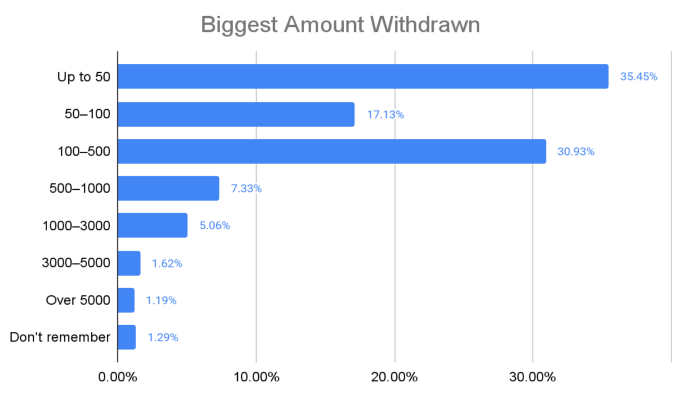
About 35.45% of respondents say that the biggest amount they have ever withdrawn from a casino is below the £50-mark, with 9.59% of them saying they withdrew an amount in the £40–50 range. That's a bit sad knowing that the biggest casino wins often surpass millions of pounds.
A total of 30.93% of UK gamblers say that the most they have withdrawn from a casino stands in the £100–500 range, with 7.22% of them agreeing to an amount between £150 and £200.
Those who have withdrawn a maximum between £50 and £100 account for 17.13% of respondents, with 11.31% being in the upper, £90–100 bracket.
As the maximum brackets increase, the percentage of respondents who have actually made withdrawals in those benchmarks decrease. About 7.33% of UK gamblers say they have withdrawn a maximum in the £500–1,000 range, with 3.23% being in the upper, £900–1,000 bracket.
A share of 5.06% of respondents says that the biggest amount they have ever withdrawn from a casino ranges between £1,000 and 3,000, with 1.62% having withdrawn a maximum in the £1,500–2,000 bracket.
About 1.62% of UK gamblers say that the most they have withdrawn from a casino stands in the £3,000–5,000 range, while only 1.19% admit to being lucky enough to withdraw over £5,000 from a casino in their lifetime.
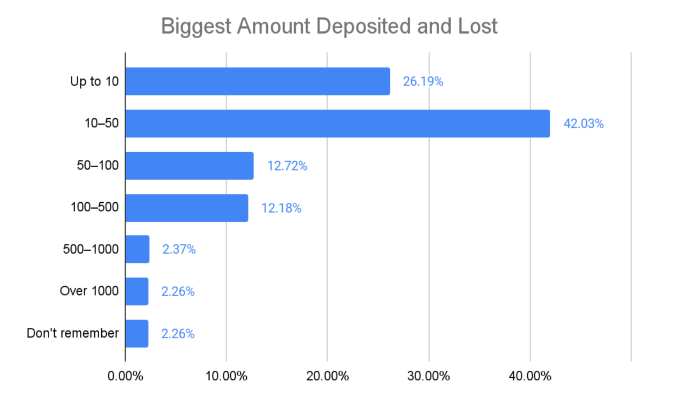
When it comes to the highest amounts they have ever deposited and lost, most respondents (42.03%) fall in the £10–50 bracket, with 16.92% admitting the most they have ever deposited and lost being in the £15–20 range.
The second-highest portion in this regard (26.19%) consists of gamblers who have deposited and lost a maximum of up to £10 in their lifetime, most of whom (18.43%) agree on an amount between £5 and £10.
About 12.72% of respondents have deposited and lost a maximum within the £50–100 bracket, most of whomh (9.16%) agree to a more narrow amount between £80 and £100. A similar portion of respondents (12.18%) admit to depositing and losing anywhere between £100 and £500, with most of them (3.88%) falling in the £150–200 bracket.
The percentage of respondents who have deposited and lost a maximum between £500 and £1,000 stands at 2.37%, with those who don’t remember and the ones who have deposited and lost over £1,000 tying at 2.26% each. When it comes to the latter, 1.29% of respondents admit to having deposited and lost a maximum of between £1,000 and £2,000 in their lifetime.
Gambling and Betting Strategies Aren’t That Popular
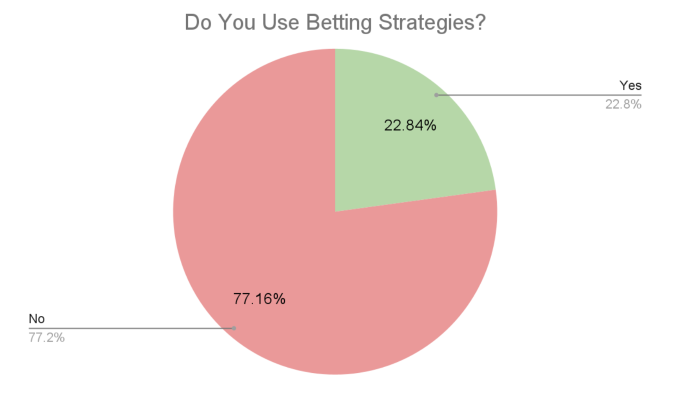
Betting strategies like the Martingale or the Fibonacci systems are very popular, at least according to search data and forum threads. Yet, it seems that UK players aren't that familiar with them or do not like using them. In fact, only 22.85% of our survey respondents admitted to using betting strategies, whereas the majority (77.16%) did not.
Sharing Gambling Habits With Others
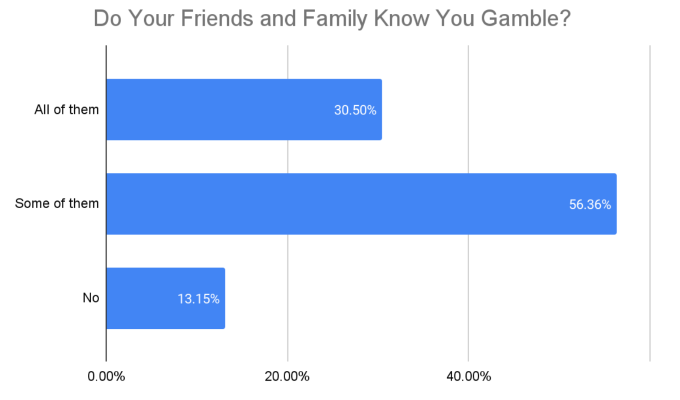
Is gambling a bad habit that players in the UK try to hide, or is it something they share with their nearest and dearest? Well, 13.15% of respondents keep their gambling activities a secret. More than half of respondents (56.36%) said that some of their family members and friends know they gambled. Finally, 30.50% claimed that all of their close friends and families know about their gambling activities.
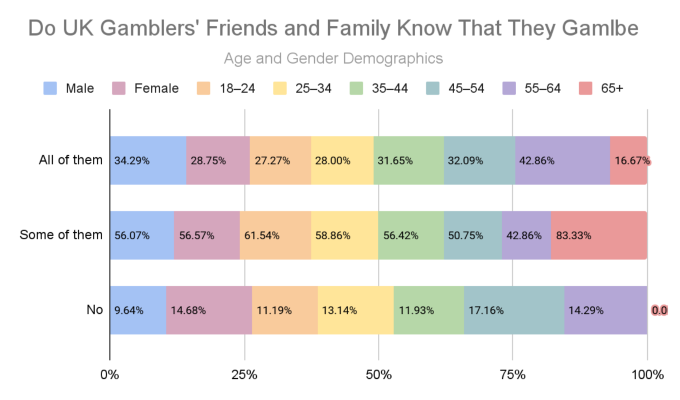
When observing these answers by gender demographics, women emerge as more discreet when it comes to gambling than men. Specifically, 28.75% of female respondents said all of their friends and families know they’re gambling, as opposed to 34.29% of men. On the other hand, 14.68% of women said that none of their friends and family know they’re gambling, as opposed to 9.64% of men.
For nearly two-thirds of the respondents (60.34%), their partner was also aware of their gambling habit. Another 9.81% said their partners knew they gambled but didn't know how much. About 7.44% said that their partner wasn't aware of their gambling activities, whereas the remaining 22.41% were single at the time of completing our survey.
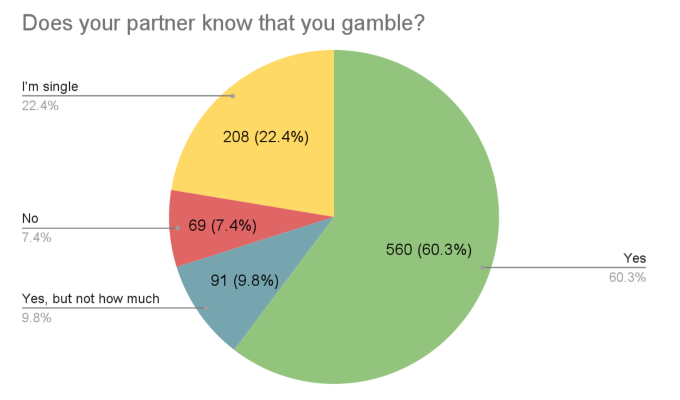
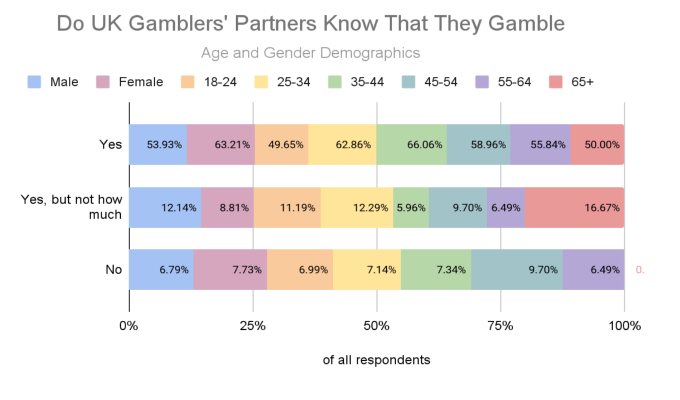
When excluding single respondents and observing the data by gender demographics, women emerge as more open with their partners. 63.21% of women and 53.93% of men said their partners know that they’re gambling. By contrast 12.14% of men and 8.81% of women said their partners don’t know how much they’re gambling.
The 34–45 age group stands out as the most open regarding their partners being aware of their gambling habits, with 66.06% agreeing so. 16.67% of those aged 65 or older do not discuss how much they gamble with their partner, while those aged 45–54 emerge as the age group with most respondents (9.70%) keeping their gambling habits from their partners.
Below, you can find the answers of all the participants except those who said they were single. Due to their removal, the totals by gender and by age group may not total to 100%.
Responsible Gambling and Dispute Resolution
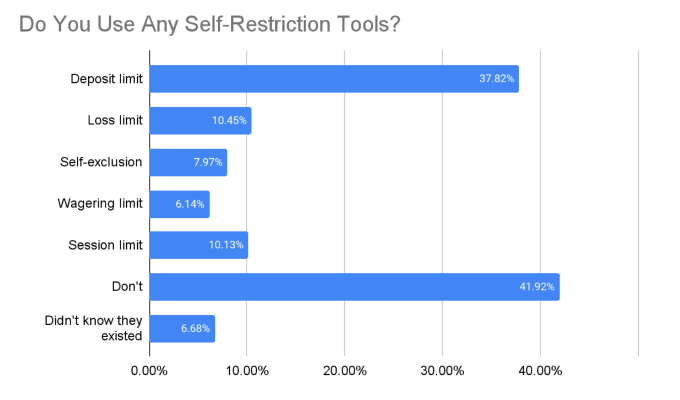
Self-restriction tools are an essential part of promoting responsible gambling and fighting gambling addiction. There are different types of self-restriction tools, yet not all of them are used equally. Surprisingly, 6.68% of our respondents didn't even know that such tools existed, and 41.92% never used them.
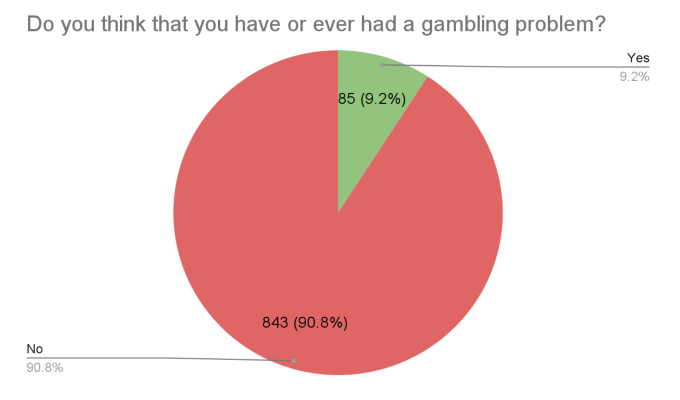
But when you discover that 90.84% of our respondents said they didn't have, nor have they ever had, a gambling problem, not knowing about self-restriction tools makes sense. A worrying 9.16% claimed to either have or have had a gambling problem.
The latest gambling addiction statistics show that the problem gambling rate in the country is at 0.3%.
Finally, we get to the infamous issues and disputes that everyone seems to complain about. In fact, according to the participants in our survey, most consumers don’t actually have negative experiences when gambling.
A stunning 94.72% of the respondents claimed to never have had an issue with a casino, and that's really great. Only 5.28% said that they did have a problem with an operator. Moreover, only 6.25% of the survey participants had a dispute, while the remaining 93.75% never had a dispute with a casino operator.
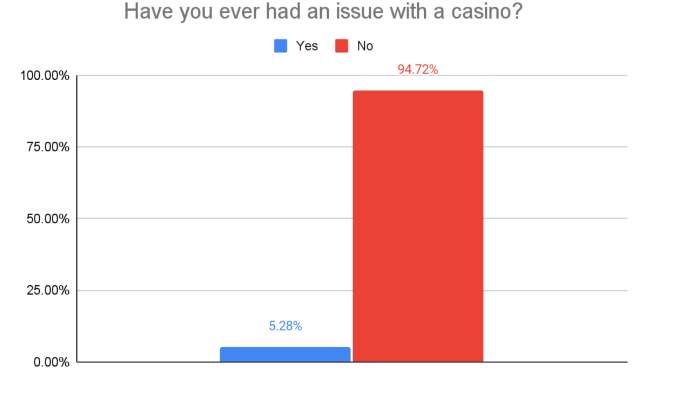
When an issue isn't resolved, it typically escalates to a dispute. So, how many of our survey respondents have had a dispute? Not that many, really.
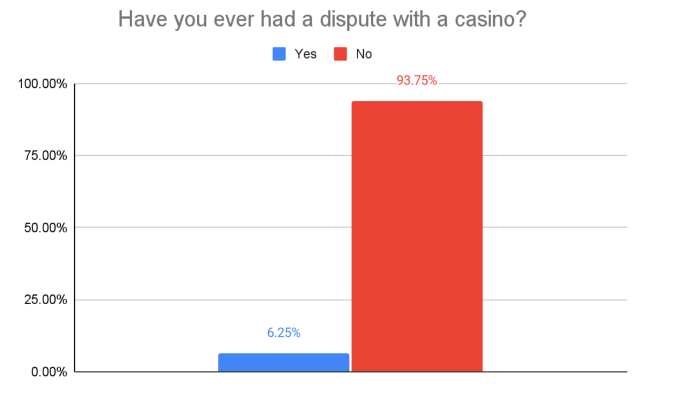 If you ask us, all this sounds good. However, it would be even better if no one reported any negative experiences such as issues and disputes, right?
Final Notes
That’s all from our proprietary GoodLuckMate survey focused on the UK gambling market. We believe that some interesting trends and habits have been highlighted by the participants in our survey.
If you have any questions or remarks, please do not hesitate to reach out to us. We’d love to hear from you.
All the data in this survey belongs to GoodLuckMate. Please make sure to mention our brand and link to this page if you use any of the information provided here or in any of the documents found below.
